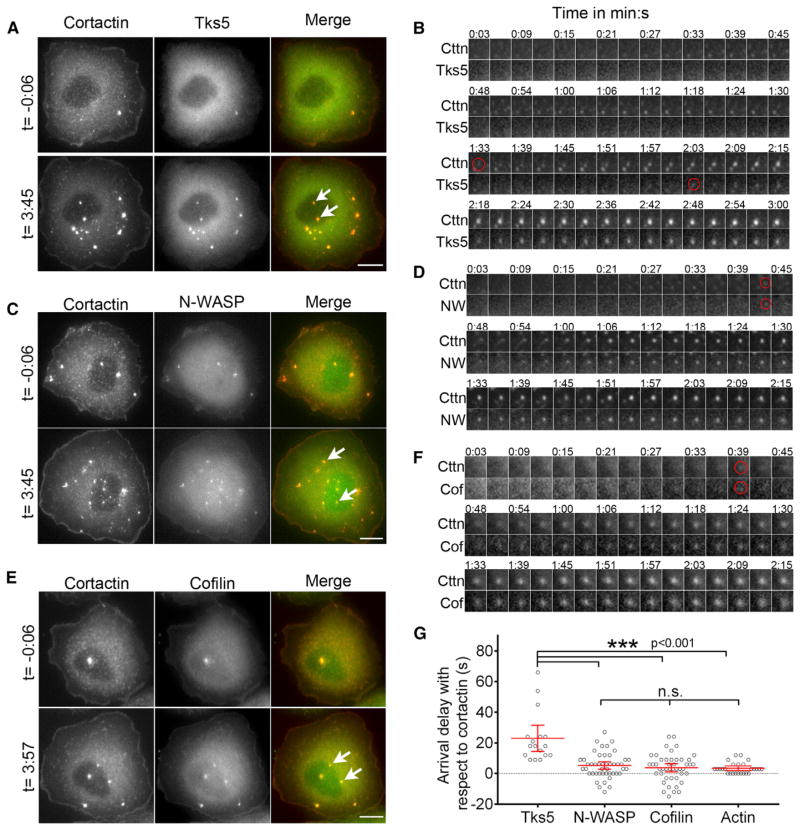
Figure 1. Arrival Kinetics of Invadopodium Precursor Core Proteins during Precursor Assembly.
(A, C, and E) MTLn3 cells showing cortactin- and Tks5- (A), cortactin- and N-WASP- (C), and cortactin- and cofilin- (E) positive invadopodia before (top panels) and after (bottom panels) EGF stimulation (see Movies S1, S3, and S4). White arrows in the merge images point to examples of newly assembled invadopodium precursors. Scale bars represent 10 μm.
(B, D, and F) Time-lapse montage of cortactin and Tks5 (B), cortactin and N-WASP (D), and cortactin and cofilin (F) fluorescence channels for newly assembled invadopodium precursors. Red circles indicate the first appearance of precursor puncta in each channel. Time 0:00 corresponds to the EGF addition.
(G) Tks5, N-WASP, cofilin, and actin arrival delays with respect to cortactin during invadopodium precursor assembly. Red lines indicate mean with 95% confidence interval. n = 17 (Tks5), 46 (N-WASP), 45 (cofilin), and 26 (actin) invadopodium precursors.
See also Figure S1.

