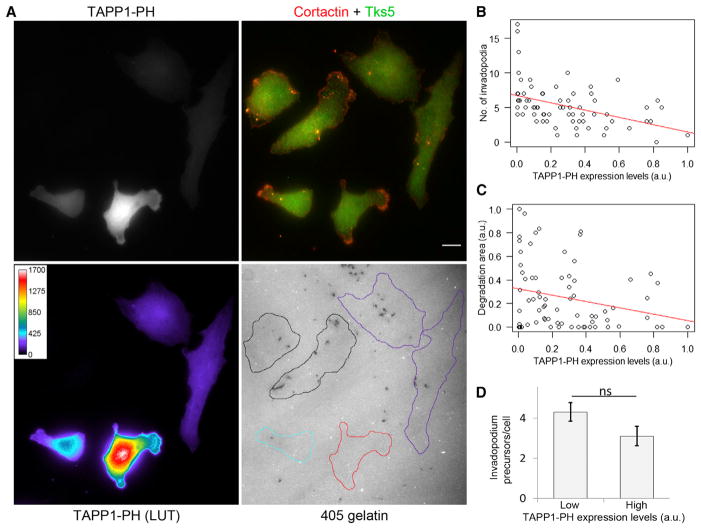
Figure 5. PI(3,4)P2 Sequestration Causes Significant Reductions in Invadopodium Formation and Matrix Degradation.
(A) Cells were transiently transfected with GFP-TAPP1-PH, plated on 405-gelatin, and stained with cortactin and Tks5 antibodies. An area with cells having varying expression levels of TAPP1-PH is shown using rainbow lookup table (LUT). Cell outlines with no (black), low (purple), moderate (cyan), and high (red) TAPP1-PH levels are shown. Scale bar represents 10 μm.
(B and C) Scatterplots showing the effect of TAPP1-PH overexpression on cells’ ability to form invadopodia (B) and degrade matrix (C). Red lines are linear regression fit. n = 73 cells.
(D) Quantification of invadopodium precursors per cell (means ± SEM) in low (lower 25th percentile) and high (upper 25th percentile) TAPP1-PH-expressing cells, indicating that PI(3,4)P2 sequestration does not affect precursor formation. n = 20 (low) and 20 (high) cells.

