
Figure 6. SHIP2 Arrival Coincides with the Beginning of PI(3,4)P2 Accumulation at the Invadopodium Precursor.
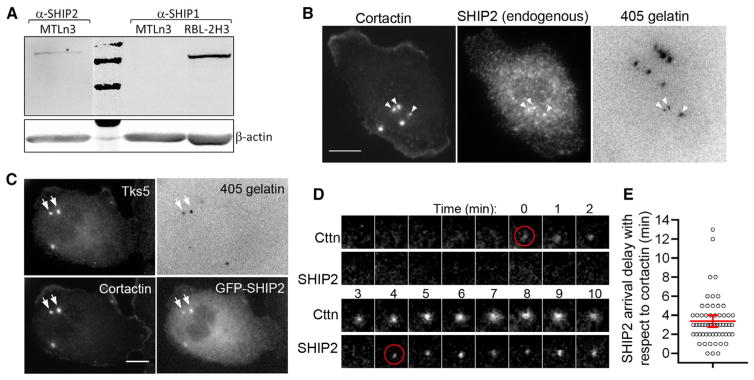
(A) MTLn3 whole-cell lysate was analyzed for the SHIP2 and SHIP1 expression levels by western blotting. Rat hematopoietic RBL-2H3 whole-cell lysate was used as a positive control for SHIP1. Second lane in the top membrane shows 250, 150, and 100 kDa marker bands.
(B) Endogenous SHIP2 distribution checked by staining cells with cortactin and SHIP2 antibodies. White arrowheads show the colocalization of SHIP2, cortactin, and degradation holes. Scale bar represents 10 μm.
(C) Cells were transfected with GFP-SHIP2 and stained with cortactin and Tks5 antibodies. White arrows show colocalization of SHIP2, cortactin, Tks5, and degradation holes. Scale bar represents 10 μm.
(D) Time-lapse montage of SHIP2 arrival kinetics during invadopodium precursor assembly by TIRF microscopy. Red circles indicate the first frame of cortactin and SHIP2 appearance. Time 0 corresponds to the appearance of the cortactin punctum.
(E) Quantification of SHIP2 arrival delay with respect to cortactin. Red lines indicate mean with 95% confidence interval. n = 60 precursors.
See also Figure S5.