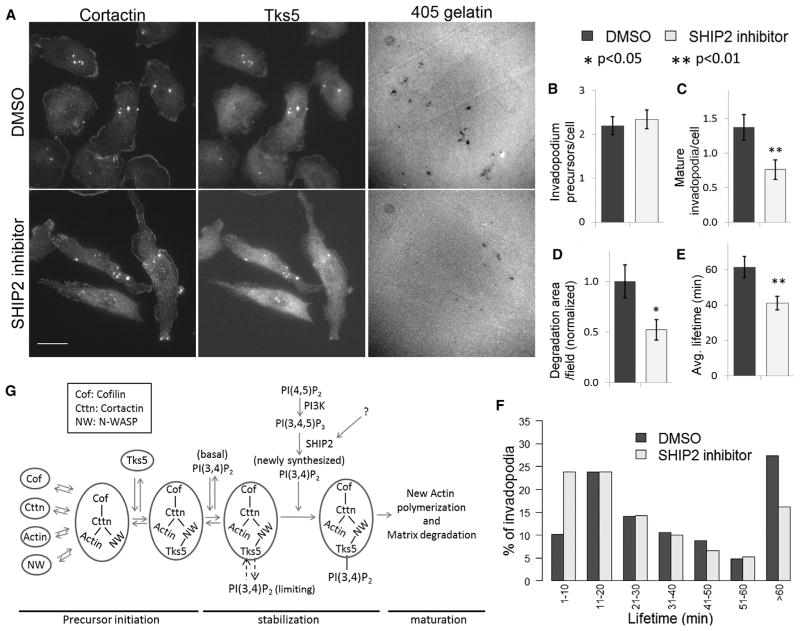
Figure 7. SHIP2 Regulates Invadopodia Lifetime and Maturation.
(A) DMSO-treated or 10 μM SHIP2 inhibitor AS1949490-treated cells were plated on 405-gelatin and stained with cortactin and Tks5 antibodies to identify invadopodia. Scale bar represents 20 μm.
(B–D) Quantification of invadopodium precursors per cell; n = 91 (DMSO) and 67 (SHIP2 inhibitor) cells (B); mature invadopodia per cell, n = 91 (DMSO) and 67 (SHIP2 inhibitor) cells (C); and degradation area per field of view, n = 25 (DMSO) and 26 (SHIP2 inhibitor) fields of view (D). Values shown are means ± SEM.
(E) Average invadopodia lifetime (means ± SEM) in DMSO-treated and 10 μM SHIP2 inhibitor-treated cells. n = 225 (DMSO) and 208 (SHIP2 inhibitor) invadopodia in (E) and (F).
(F) Invadopodia lifetime distributions in cells treated with DMSO or 10 μM SHIP2 inhibitor.
(G) A sequential model of invadopodium precursor assembly. Cofilin, cortactin, actin, and N-WASP arrive together to form the invadopodium precursor, followed by Tks5 arrival, which stabilizes the precursor by binding to basal PI(3,4)P2 at the plasma membrane. This is followed by a burst in actin barbed-end activity [13] and recruitment of SHIP2 at the precursor, which results in local PI(3,4)P2 production at the precursor. Increased PI(3,4)P2 production supports a growing invadopodium precursor, leading to its maturation and matrix degradation.
See also Figures S5 and S6.

