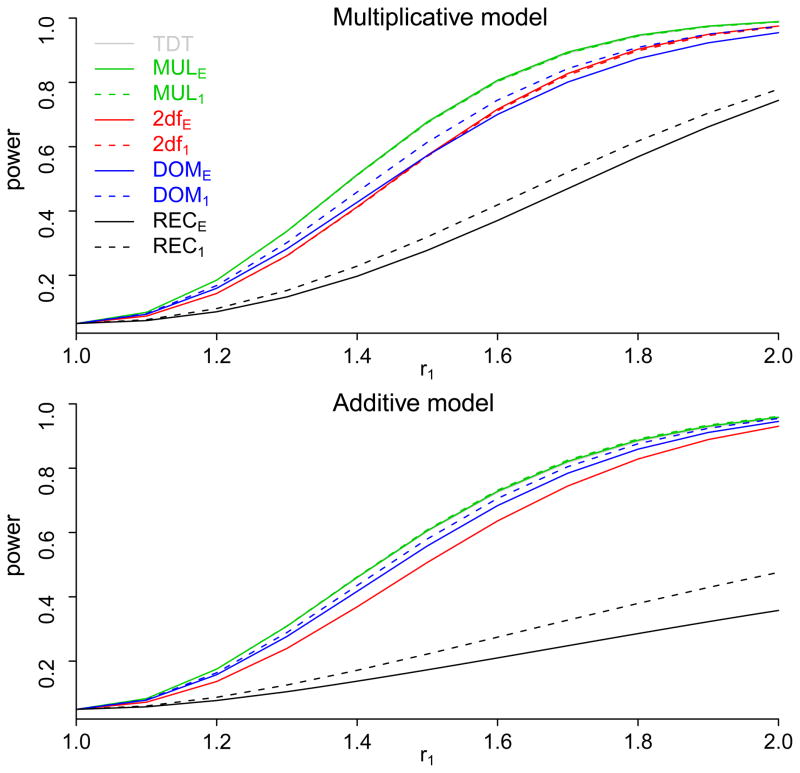
Figure 2.
The power of the nine tests: MUL, DOM, REC, and 2df tests for each of the two matching strategies, and the TDT test. Because the power curves of the TDT and MULE almost overlap to each other, it is hard to see the curves of the TDT on the plots. Upper panel: power curves when the true genetic model is multiplicative; lower panel: power curves when the true genetic model is additive.

