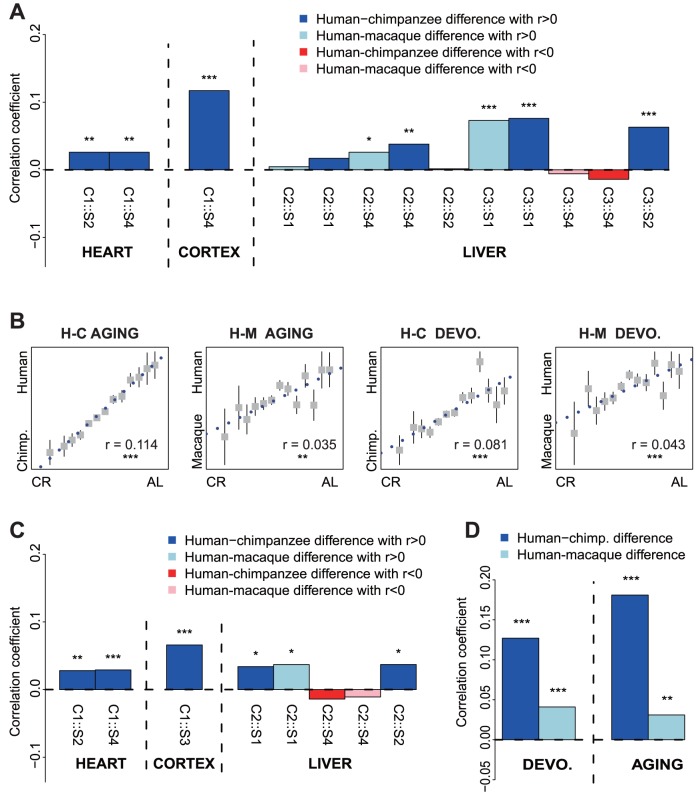
Figure 1. Correlations between human-specific gene expression divergence with CR-induced gene expression changes in mice.
Normalized gene expression divergence (effect size) between humans and non-human primates was compared with the normalized expression difference (effect size) between CR mice and ad libitum-fed (AL) mice in each tissue. A: Bar plot representing the Pearson correlation coefficient between human and non-human primate differences and the CR effect in heart, cerebral cortex and liver. Each bar represents a comparison, and the text (e.g. C1::S2) below each bar gives the reference for the data sets used in a comparison (see Table 1). B: Scatter plot of primate species differences and CR effect in the cerebral cortex. The x-axis represents the effect size for human and non-human differences; the y-axis represents the effect size for CR and AL differences. Genes with similar CR-AL effect size were binned together to calculate the mean value for each group of genes and the bars represent the variance of each bin. The significance of the correlations are based on the Pearson correlation test, using all expressed genes. Pearson correlation coefficients and significance levels are shown inside the panels. H-C AGING: Correlation of human-chimpanzee differences with the CR effect for the aging period (post-adulthood). H-M AGING: Correlation of human-macaque differences with the CR effect in aging. H-C DEVO: Correlation of human-chimpanzee differences with the CR effect in postnatal development. H-M DEVO: Correlation of human-macaque differences with the CR effect in postnatal development. C: Bar plot representing the Pearson correlation coefficient between human and non-human primate differences and the resveratrol effect in cerebral cortex, heart and liver. Each bar represents a comparison, and the text (e.g. C1::S2) below each bar gives the reference for the data set used in a comparison (see Table 1). D: Bar plot representing the correlation of human and non-human primate differences with resveratrol effect in the cerebral cortex for both postnatal development and aging periods. The asterisks indicate correlation significance levels corrected for multiple testing: *: p<0.05; **: p<0.01; ***: p<0.001.

