
Figure 3. Time-shift between human and mouse expression profiles in the mTOR pathway.
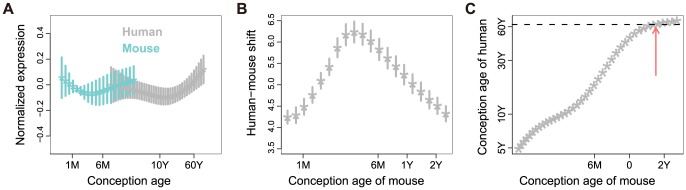
A: mTOR pathway gene expression curves of human and mouse prefrontal cortex. The x-axis shows log-transformed age from conception (“conception age”) values for both human and mouse, and the y-axis shows the normalized gene expression value. Each asterisk represents the mean expression value for a certain age point and horizontal bars represent the expression variance of genes within the mTOR pathway (only 42 of the 52 genes that showed substantial correlation (Pearson r>0.5) with the average pathway profile were included). B: Human-mouse time-shift. The x-axis shows the age from conception of mouse, and the y-axis shows the time-shift of human age relative to mouse age. Each asterisk represents the average time shift of genes within the mTOR pathway, and the bars show the variance of each time point. C: Scatter plot of human age plotted against mouse age according to the human-mouse time-shift values. The x- and y-axes show the age from conception of mouse and human, respectively. The red arrow indicates the point where human age equals 600 days of mouse age based on the time-shift calculation for the mTOR pathway genes.