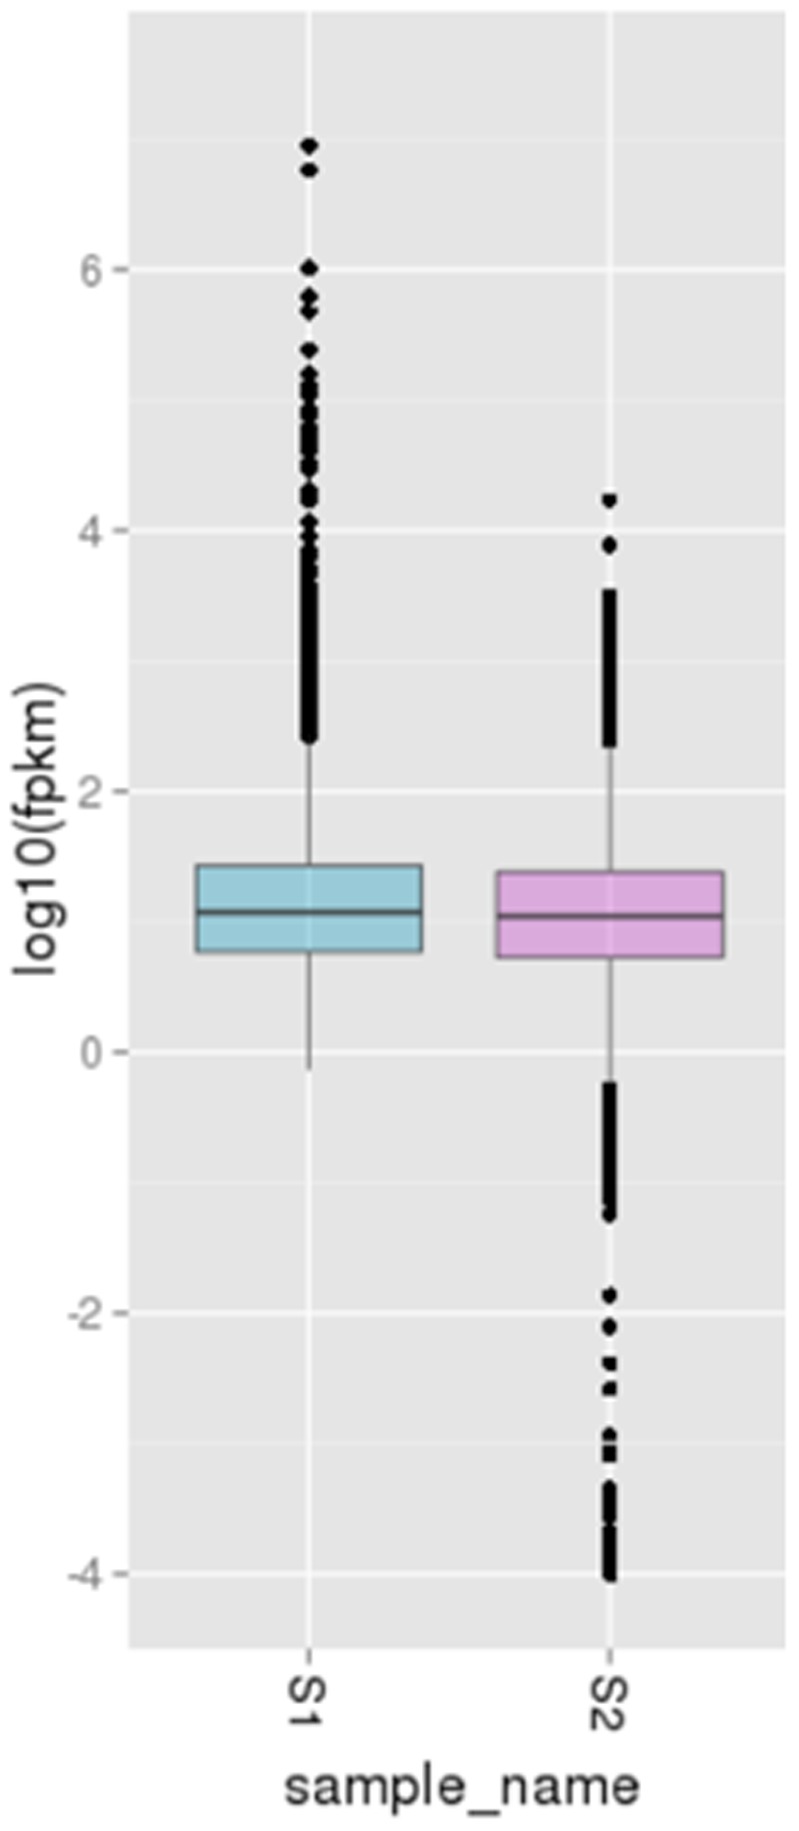
Figure 3. Boxplot of the log FPKM (Fragments Per Kilobase of exon per Million fragments mapped) expression values in both the green- (S1) and the russet-pericarp pool (S2) libraries of sand pear.

The figure shows that the median of the expression values across the libraries being compared for differential expression are comparable.
