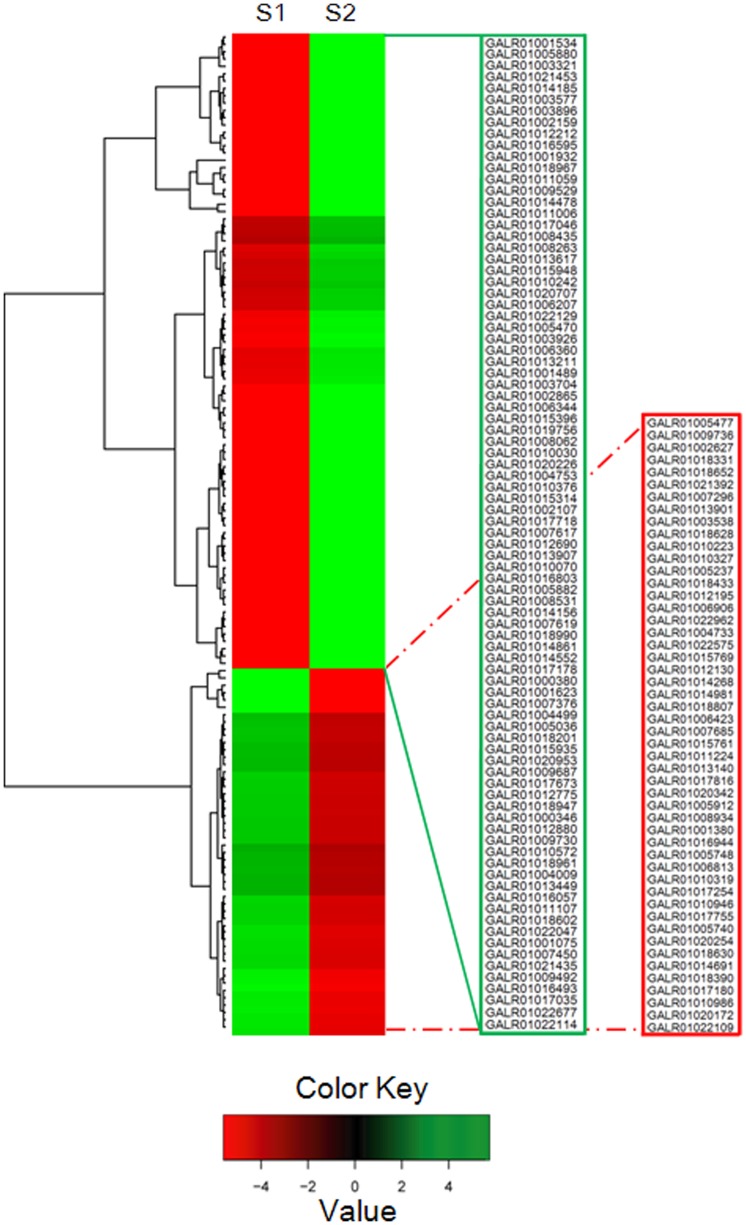
Figure 4. Cluster analysis of genes (137 in total) differentially expressed between the green- (S1) and the russet-pericarp (S2) pool libraries.
The Cluster analysis was performed using Hierarchical cluster analysis. Rows represent differentially expressed genes, columns represent contrast groups. Green and red boxes represent genes showing lower and higher expression level, respectively. The unit of measurement used by Cufflinks to estimate transcript abundance is Fragments Per Kilobase of exon per Million fragments mapped (FPKM). Color saturation reflects magnitude of log2 expression ratio for each gene. Annotations of part genes see Table S1 in File S1.

