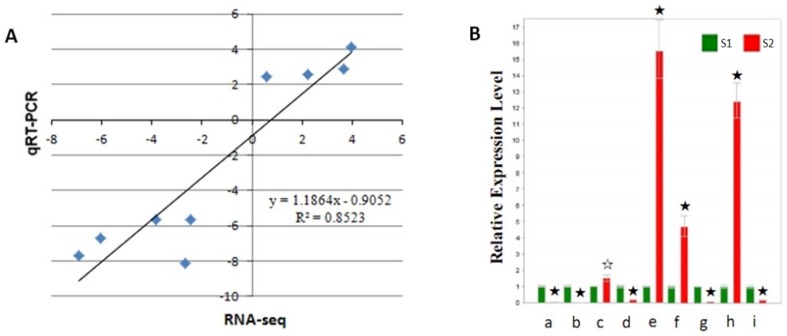
Figure 6. qRT-PCR validation of differentially expressed genes between the two pericarp pools of sand pear.
A, Correlation of fold change analyzed by RNA-Seq platform (x axis) with data obtained using real-time PCR (y axis). B, Expression analysis of the 9 differentially expressing unigenes revealed by RNA-seq assessed through qRT-PCR. S1 and S2 represent the sand pear pericarp pools of 80 DAP the green- (S1) and the russet-pericarp fruits (S2), respectively. The expression level of these unigenes in S1 was normalized to be the same. a∼i represent the 9 differentially expressing unigenes, i.e. a, GALR01005880; b, GALR01015948; c, GALR01006906; d, GALR01012212; e, GALR01009736; f, GALR01010946; g, GALR01016595; h, GALR01020254 and i, GALR01020707, respectively (Table S1 in File S1). Error bars represent SE (n = 3). Asterisks indicate levels of significance of differential expression (t test: ☆, P<0.05; ★, P<0.01).

