
Figure 4. RT-PCR analysis of differentially expressed cytokine, chemokine and proliferation-associated genes in AT-MSC from different donors and different cell densities.
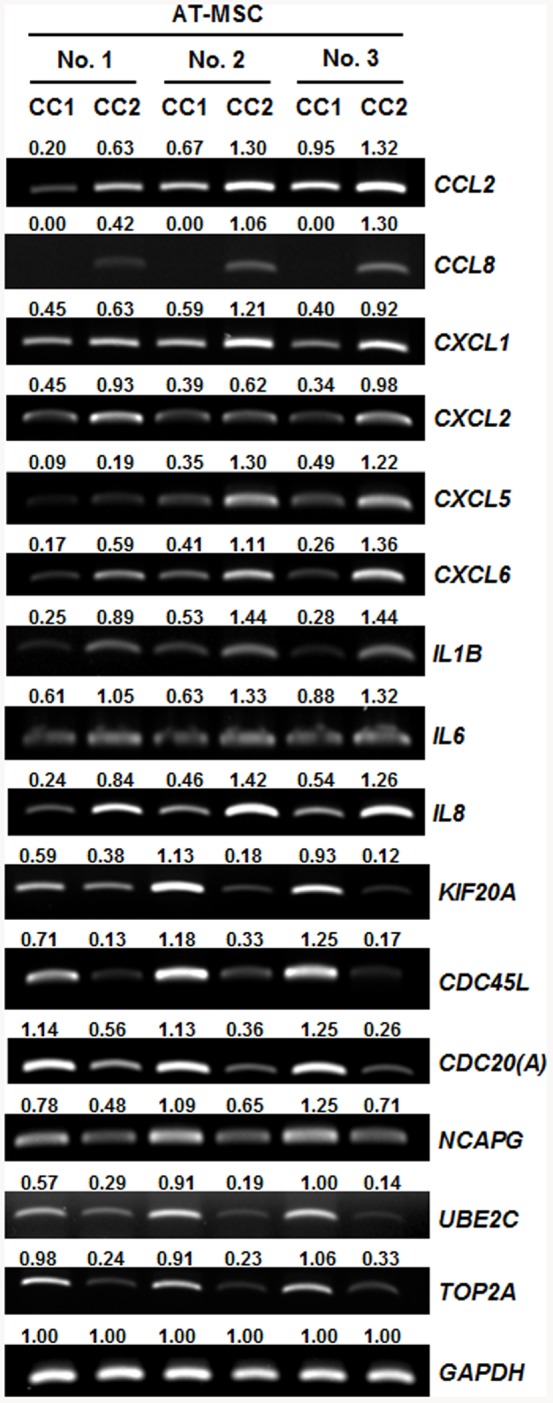
The expression profile of selected genes from the microarray data was validated by semi-quantitative RT-PCR using independent samples harvested 7days after plating at different cell densities as distinct from that for microarray analysis. Quantitative gene expression data of each candidate gene indicates mRNA expression relative to GAPDH mRNA. Band intensity was normalized against that of GAPDH mRNA. Semi-quantitative RT-PCR analysis was independently performed using different MSC samples but the samples for microarray analysis. CC1, cultures plated with an initial cell density of 200 cells/cm2 and a culture duration of 7 days; CC2, cultures plated with an initial cell density of 5,000 cells/cm2 and a culture duration of 7 days.