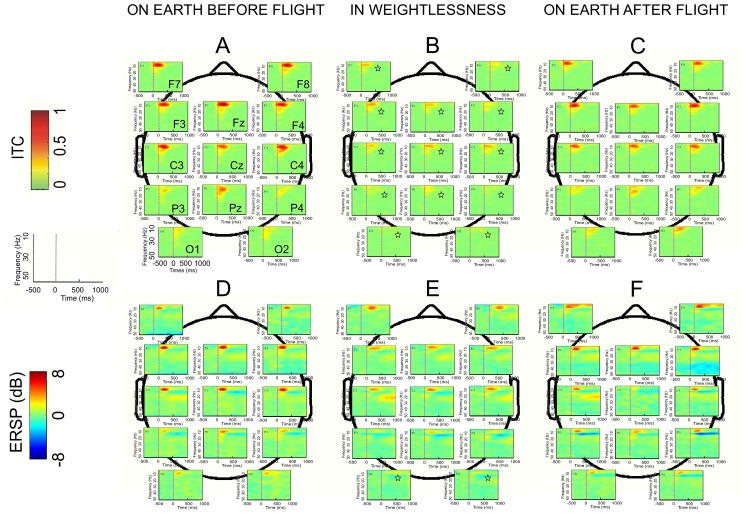
Figure 3. Effect of microgravity on the topographical representation of ITC and ERSP.
ITC are represented in the upper part (A – C) and the ERSP in lower part (D – F). Grand average (n = 5) triggered by the 3D-tunnel presentation on Earth before flight (A , D) in weightlessness (B , E) and on Earth after flight (C , F). Each map corresponds to a single recording channel (from F7–F8 to O1–O2) disposed on the scalp. Statistical significance (Friedman ANOVA) p<0.05 is indicated by an asterisk.

