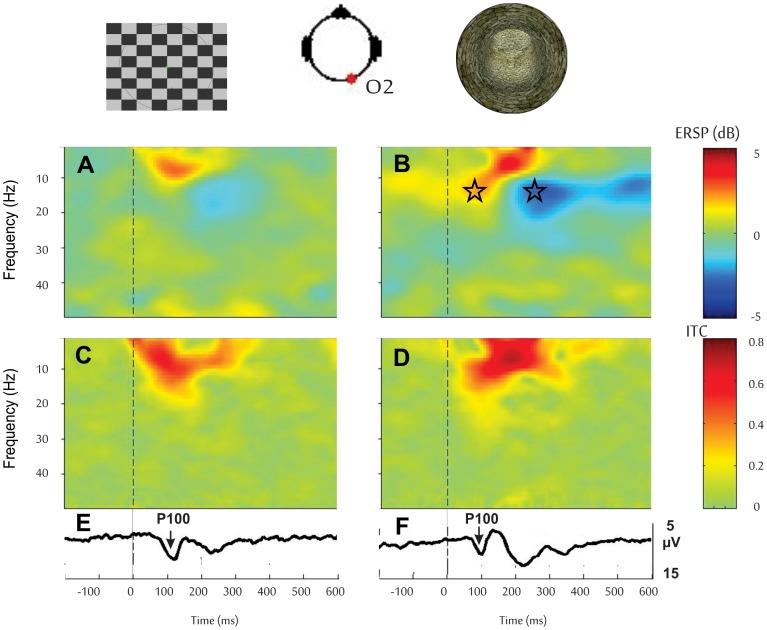
Figure 4. Comparison between checkerboard and 3D tunnel stimuli given at 1 Hz in control participants on Earth.
From top to bottom, the ERS, ITC and ERP triggered by the checkerboard (A , C , E) and by the 3D-tunnel pattern (B , D , F). The triggers (vertical dashed lines) were given at time zero. The stars indicate stronger ERS in the upper alpha band (∼15 Hz) followed by a stronger ERD at about 200 ms in the upper alpha band (∼15 Hz) with respect to the checkerboard pattern.

