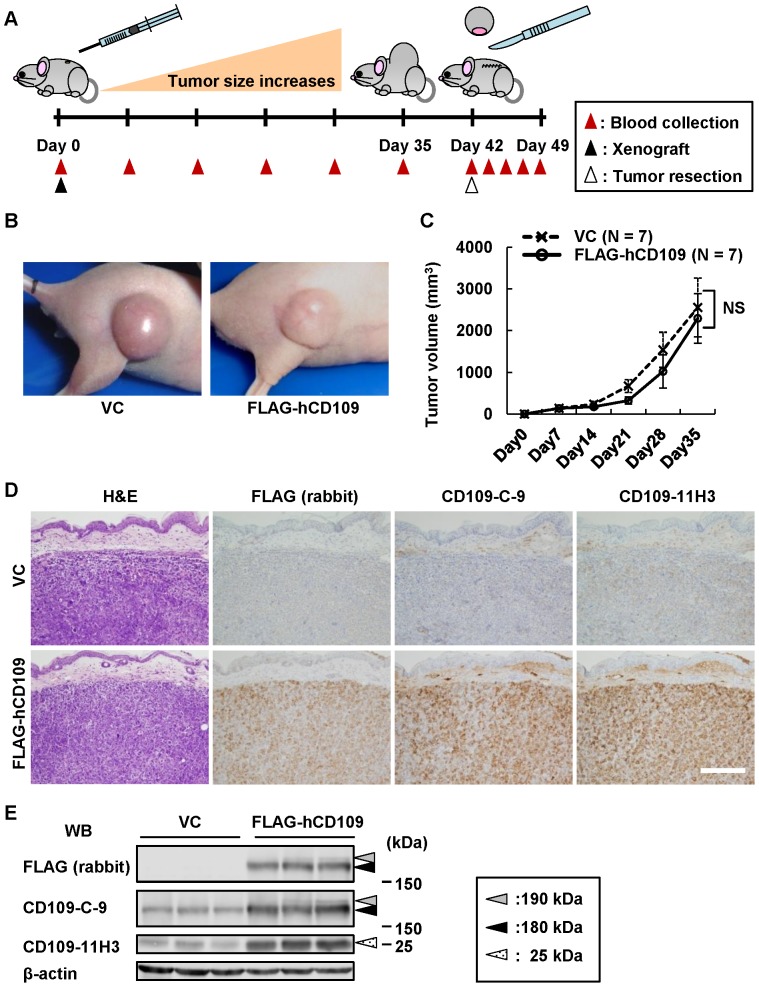
Figure 4. Characterization of tumors developed in xenografted mice.
A, Schematic illustration of the schedule of xenografted mice experiments using HEK293-FLAG-hCD109 and -VC cell lines. Blood was collected every 7 days after the xenograft until tumor resection, and 17, 48, 72 and 168 h after tumor resection. B, Gross appearance of xenografted tumors in mice. C, Growth curves of xenografted tumors. Seven xenografted tumors of HEK293-FLAG-hCD109 and seven xenografted tumors of HEK293-VC were analyzed for tumor volume, as indicated in Materials and Methods. NS: not significant, using Tukey–Kramer's HSD test. D, Histopathological appearance of xenografted tumors. Sections of xenografted tumors resected at Day 42 were subjected to H&E staining, and immunohistochemical staining with the indicated antibodies. Scale bar: 200 µm. E, Expression of CD109 in xenografted tumors. Total cell lysates from three of each xenografted tumor groups of HEK293-FLAG-hCD109 and -VC cell lines were analyzed for CD109 expression by western blotting. Dotted-white, black and gray arrowheads: 25-, 180- and 190-kDa bands, respectively. Blots of anti-β-actin antibody shown as internal control.

