
Figure 2. Expression pattern of miR398 and target genes CSD1 and Nod19 in tissues from common bean plants under copper deficiency (CuD) or copper toxicity (CuT).
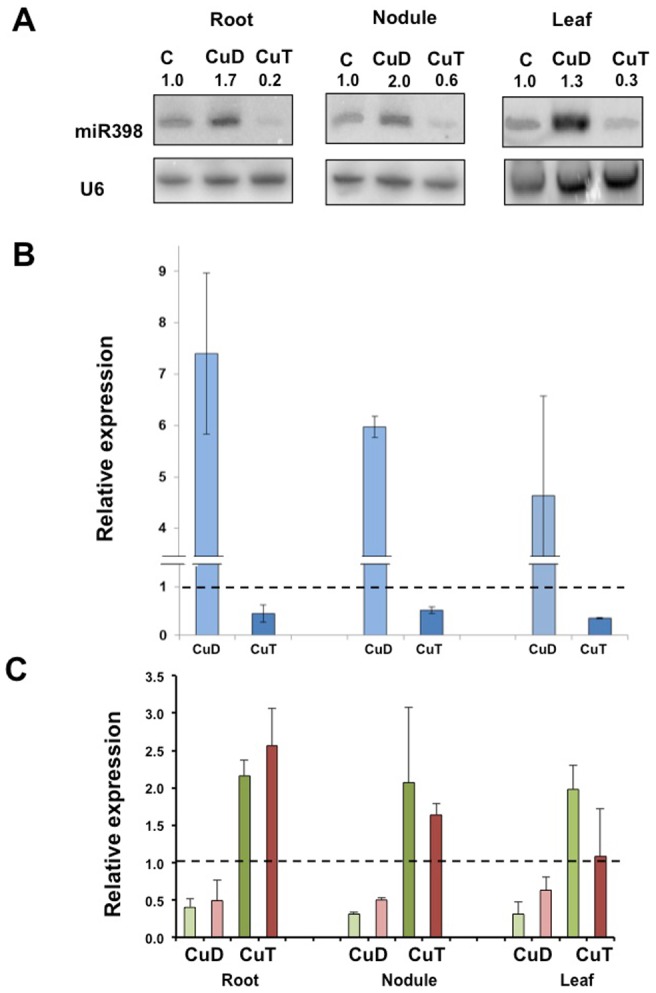
(A) miR398 levels in roots, nodules and leaves of plants grown under control (C) or stress (CuD or CuT) conditions were detected by Northern blot analysis using U6snRNA as loading control. Signal intensity of the hybridization bands was calculated and the expression ratio (stress:control) was obtained. Relative expression of (B) miR398b (blue) and of (C) target genes CSD1 (green) and Nod19 (red) in roots, nodules and leaves of plants grown under CuD (light colors) or CuT (dark colors) as determined by qRT-PCR. Values were normalized to the value from the C condition that was set to 1 as indicated with a dashed line. Values represent the average ± SD from three biological replicates.