
Figure 5. ROS content and expression pattern of miR398 and target genes CSD1 and Nod19 in roots inoculated with Rhizobium tropici.
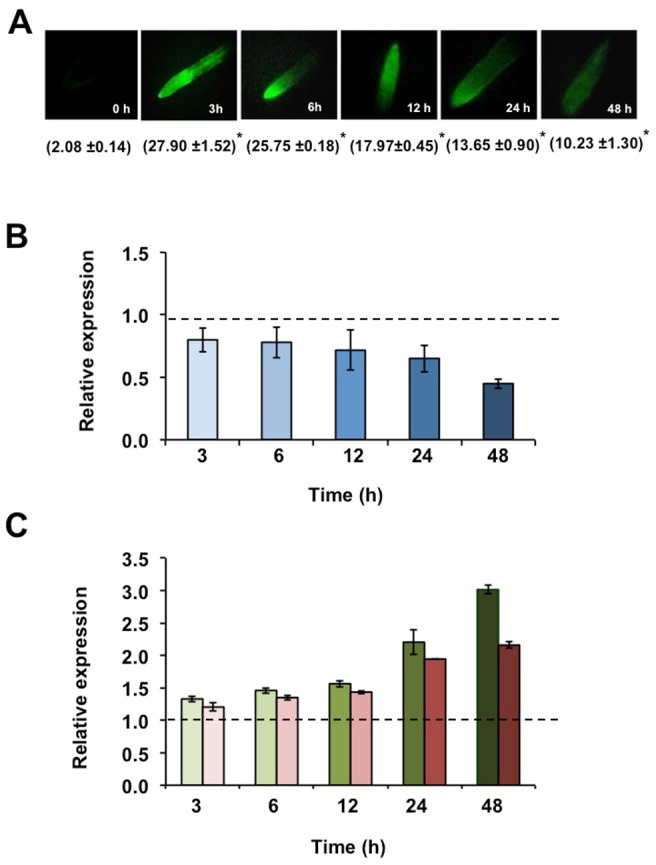
Measurements were done at initial time (0 h) and 3, 6, 12, 24 and 48 h after inoculation with R. tropici. (A) Histological (fluorescence) detection of ROS accumulation in inoculated root tips using 2′,7′- dichlorodihydrofluorescein diacetate (H2DCF-DA). The values in parenthesis indicate the average integrated fluorescence intensity per unit area of root tissue ±SD. Asterisk: Student's t test, P≤0.05. Relative expression, determined by qRT-PCR, of (B) miR398b (blue) and of (C) target genes CSD1 (green) and Nod19 (red) in inoculated roots at the indicated time points. Values were normalized to the value from the C condition that was set to 1 as indicated with a dashed line. Values represent the average ± SD from three biological replicates.