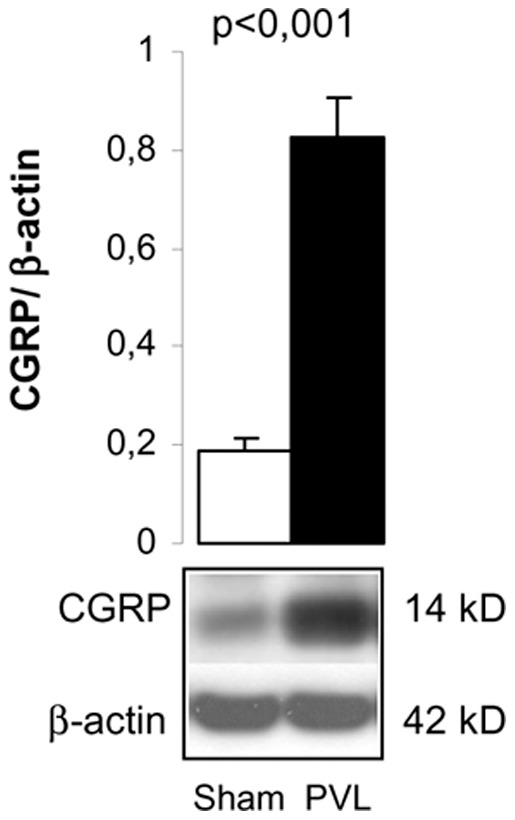
Figure 2. Calcitonin gene related protein (CGRP) in the nodose ganglion.

Bar diagram showing CGRP quantitation by Western blot analysis in sham (n = 6) and PVL (n = 7). Representative Western blot is shown below.

Bar diagram showing CGRP quantitation by Western blot analysis in sham (n = 6) and PVL (n = 7). Representative Western blot is shown below.