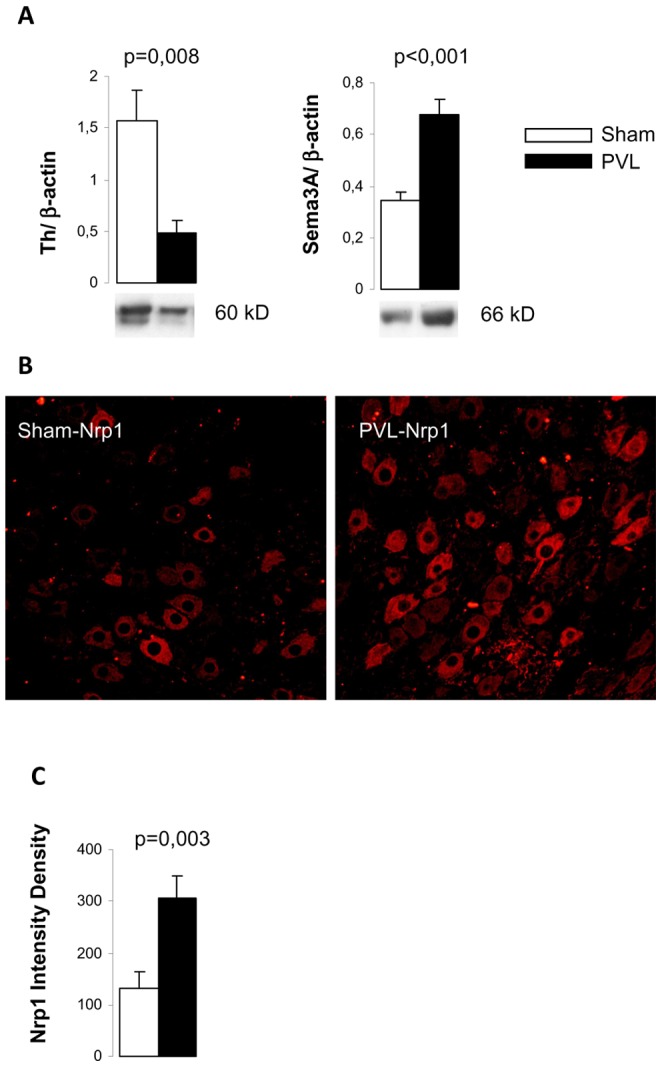
Figure 4. Tyrosine hydroxylase (Th), semaphorine 3A (Sema3A) and neuropilin (Nrp1) in the superior mesenteric ganglion (SMG).

(A) Bar diagrams showing Th and Sema 3A quantitation by Western blot analysis in sham (n = 6) and PVL (n = 7). Representative Western blots are shown below. (B) Representative images of Nrp1 immunoreactivity in sections of SMG at 400× from sham (n = 6) and PVL (n = 5). (C) Quantitation of intensity density of Nrp1 fluorescence in each experimental group.
