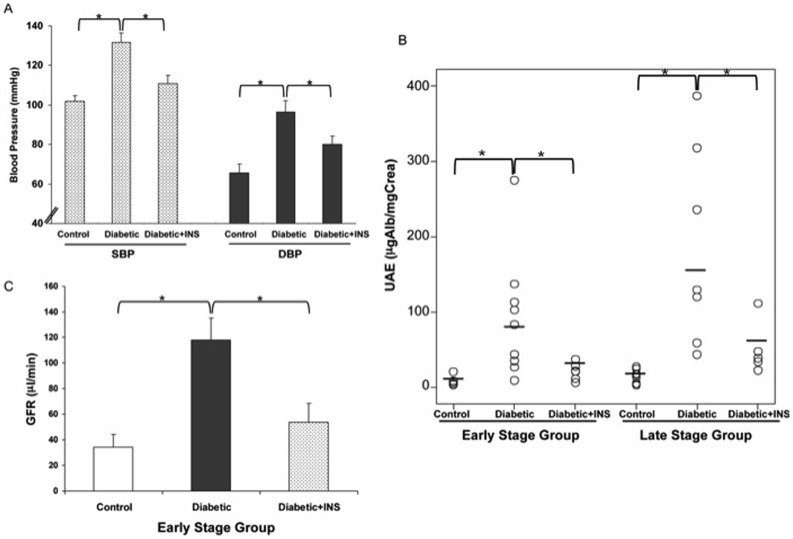
Figure 1. Blood pressure and kidney function parameters in non-treated non-obese diabetic mice (Diabetic), NOD-insulin treated mice (Diabetic+INS) and non-obese resistant non-diabetic mice (Control).
A: At the end of the early stage study, systolic and diastolic blood pressure measured by tail-cuff method in Diabetic, Diabetic+INS and Control mice. B: Urinary albumin/creatinine ratio of Diabetic, Diabetic+INS and Control mice at both study stages. C: Glomerular filtration rate measured by inulin in Diabetic, Diabetic+INS and Control mice studied at early stage of diabetes. *P≤0.05.

