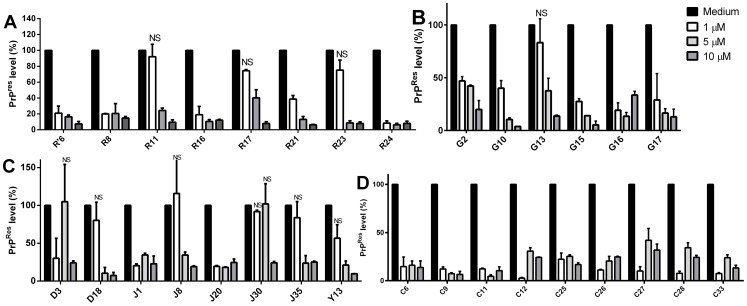
Figure 4. Dose-response curves showing PrPRes accumulated in ScN2a cells grown in the presence of selected compounds.
ScN2a cells were treated with compounds from the R and R' (panel A); G (panel B); D, J and Y (panel C); and C series (panel D) at 1, 5, or 10 µM. Control bar (medium) represents intensity density of the blot from wells without compound addition, corresponding to 100% of PrPRes content. Quantification of the assay was done by integration of the density of each dot using ImageJ software considering as control the final DMSO concentration in each well. All bars had * P<0.05 in relation to control except those labeled as NS (non-significant).

