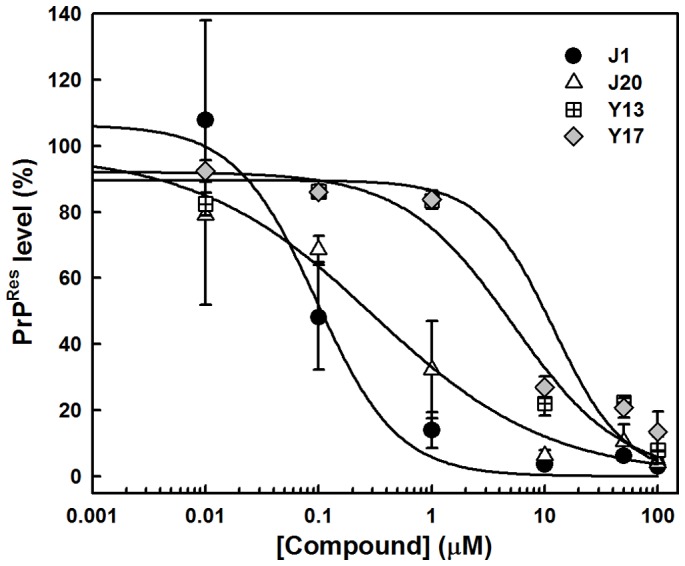
Figure 5. Dose-response curves for compounds from the J and Y series.

Lysates of ScN2a cells grown in the presence of the compounds for 4-blotted as described in the Methods section. Quantification of the relative dot-blot signal intensities were done with ImageJ considering as the control the final DMSO concentration in each well. The curves were fitted by a sigmoidal curve with SigmaPlot software v. 10.0.
