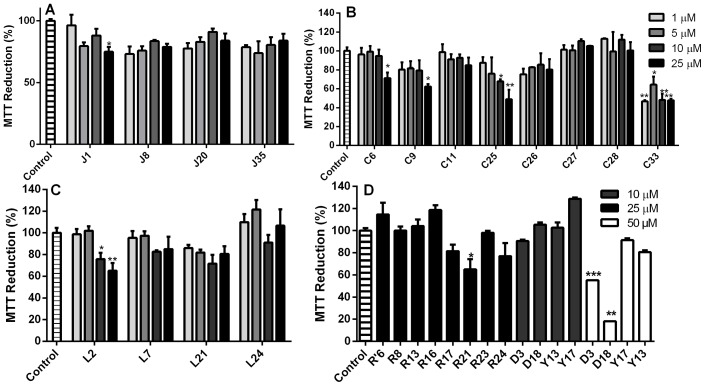
Figure 6. Cellular dysfunction evaluated by MTT reduction in the presence of selected compounds.
Dose-response results for compounds from the J (panel A), C (panel B), L (panel C), and R, R', Y and D series (panel D) applied to neuroblastoma (N2a) cells in 96-well plates. Compounds were added to N2a monolayers at final concentrations of 1, 5, 10, 25 and/or 50 μM. After 72 h, MTT reduction was evaluated as described in the Material and Methods section. Data are expressed as the percentage of MTT reduction in relation to the control (0.25% DMSO in complete cell media). Error bars represent standard deviations of at least three independent measurements, each one in triplicate. *P<0.05; **P<0.01; ***P<0.001.

