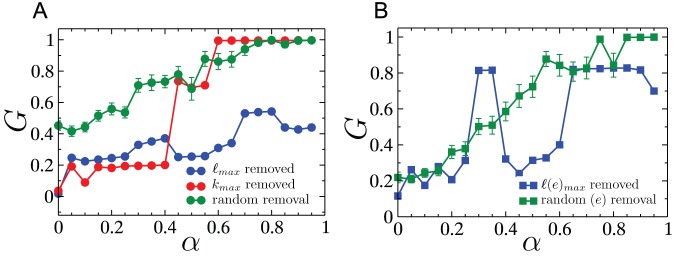
Figure 12. Cascades on the UCTE network.

(A) Cascades triggered by the removal of a single node where the node was chosen using three different criteria i.e. randomly, highest load or highest degree. (B) Cascades triggered by the removal of a single edge where the edge was either chosen randomly or was the one with the highest load. Data obtained for cascade triggered by the random removal of a single node (edge) were averaged over  different scenarios.
