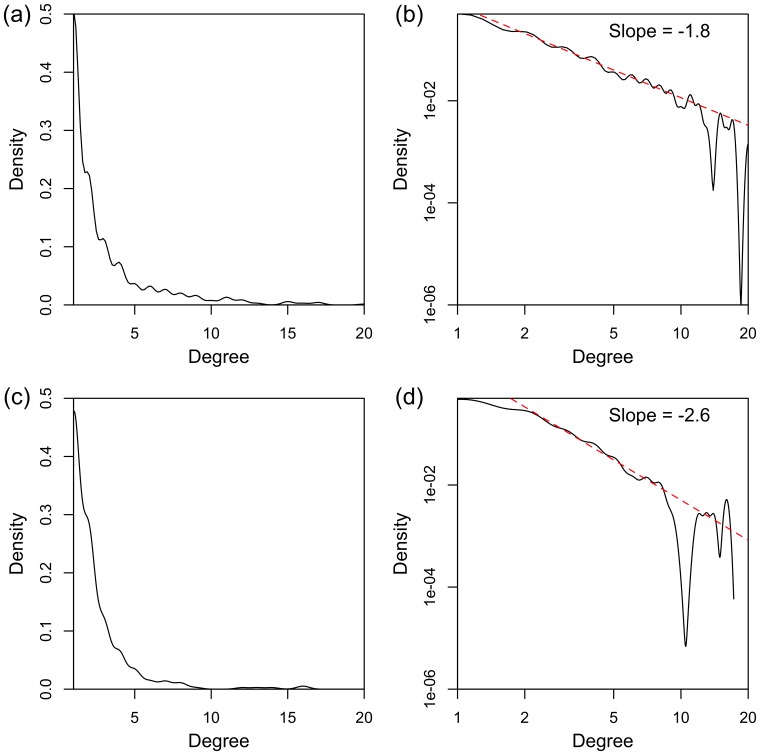
Figure 5. Larger significant subnetworks: degree distributions.
Degree distributions (kernel-smoothed) on linear and log scales, for (a), (b) KIRC large subnetwork, and (c), (d) LUAD large subnetwork. Dashed red lines on the log-log plots display the power-law linear model line of best fit, estimated from the nodes with degree in the range 2 to 8, with the corresponding slope value (i.e., power law exponential coefficient) displayed above.

