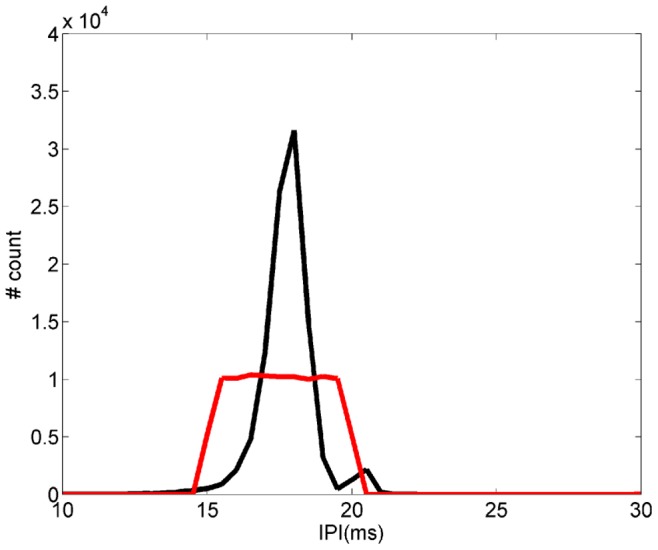
Figure 2. Stimuli histograms.

Real IPI stimulus histogram (in black). The IPIs were recorded (30 min) from a non-stimulated fish immediately after being introduced in the tank. Random IPI stimulus histogram (in red). IPIs from 15 ms to 20 ms were generated with the same probability (flat distribution) by computer.
