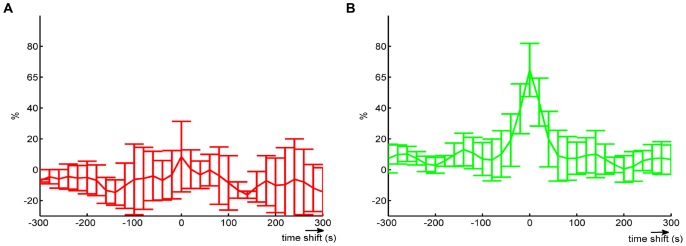
Figure 5. Cross-correlation between entropy and movement.

A – Mean cross-correlation for the transient period. At lag 0, entropy and movement were only 10% correlated. The correlation remained low for all lags. Error bars indicate the standard deviation obtained from experiments with 3 fish. B – Cross-correlation for the stationary period. Entropy and movement were highly correlated (70%) at lag 0 and it quickly decreased.
