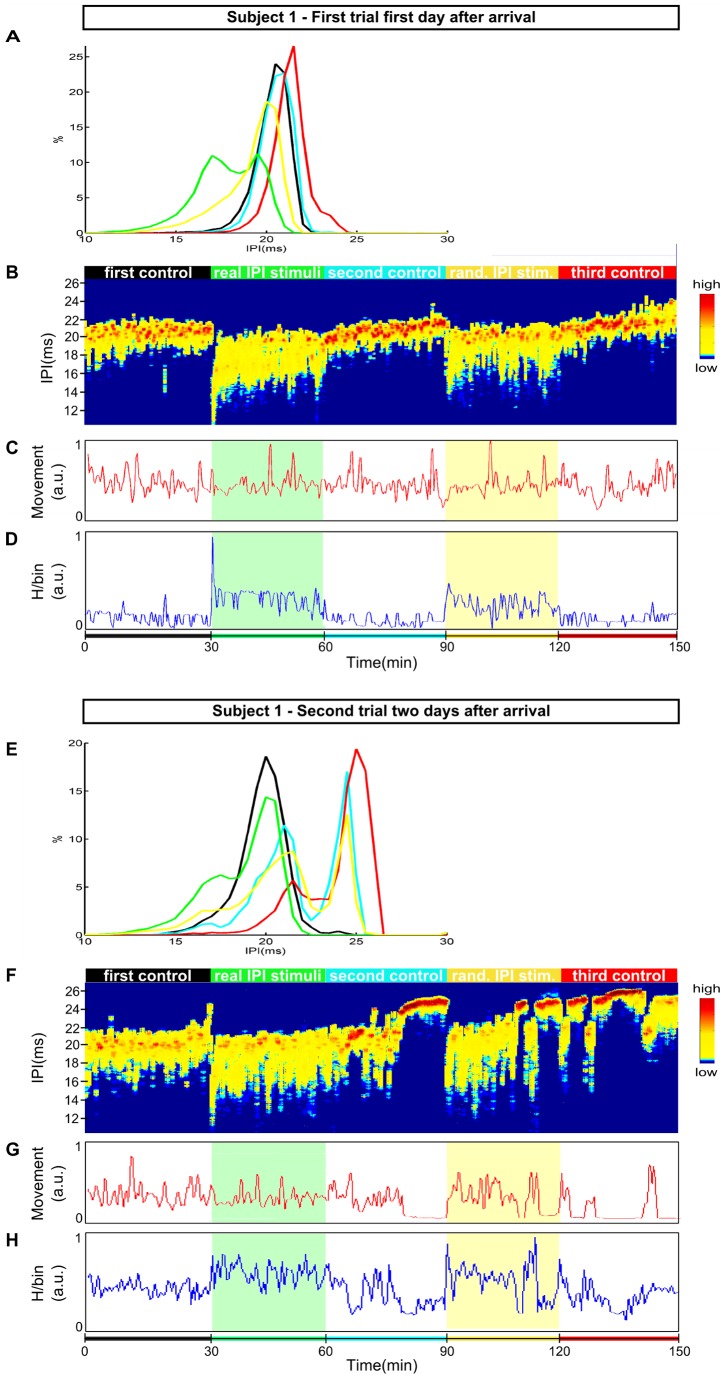
Figure 6. Experiments with stimulation.
The protocol was a sequence of 5 sessions (30 min each) as follows: first control recording (without stimulation)(black), stimulation with a real distribution of IPIs (green), second control (blue), stimulation with random distribution of IPIs (yellow), and a final control (red). A- Histograms of the response IPIs for each session: first, second and third controls in black, blue and red respectively. Response to real stimuli in green and to random one in yellow. In the first 30 min, fish discharged mostly 20.5 ms IPIs. In response to real IPI stimuli, the IPI distribution was bimodal with 2 equally probable values: 17 ms and 19.5 ms. In the second control session the IPI distribution changed presenting a single sharp peak in 21 ms. The distribution in response to a random stimuli was broader than for the control session with a single peak in 20 ms. The fish reacted to the third control session firing mostly longer IPIs with a peak in 21.5 ms. B – Sliding window histogram of IPIs versus time. High (low) probabilities are shown in red (blue). The same colorcode (red/yellow/blue) associated with high/intermediate/low probability explained in Fig. 5 is used here. C – Inferred movement, and D – entropy versus time. Fish reacted to both stimuli by decreasing the IPIs values (increasing the EODs frequency) and increasing its variability from 19–22 ms to 14.5–21 ms. During random stimuli (yellow bar) fish presented a slight relaxation with the peak of IPIs tending to higher values over time from 20 ms to 21.5 ms as well as in the third control session from 21 ms to 23 ms. The fish was restlessly moving throughout the experiment with no simple relation to the stimulation sessions. The entropy clearly increased (decreased) when both stimuli were turned on (off). E – Same as A but 2 weeks later. For the first 30min, the IPI distribution presented a single sharp peak in 20 ms (black). For the rest of the sessions the IPI distribution were bimodal differing in the peak values. The fish fired shorter IPIs (17.5 ms) in response to a real IPI stimuli session (green). The IPI distributions in response to the second control (blue) and random stimuli (yellow) were very similar with peaks around 21 ms and 24.5 ms. For the last control session fish fired longer IPIs compared to the previous sessions with peaks in 21.5 ms and 25 ms. F-H D-F – same as A-C B-D but for an experiment performed 2 weeks later with the same individual. The same qualitative behavior was found with the remarkable exception that during the stimulation with a random distribution fish presented several epochs characterized by: very high IPI values around 24.5 ms, absence of movement, and very low entropy values, probable sleep-like state that was expected only during control sessions.

