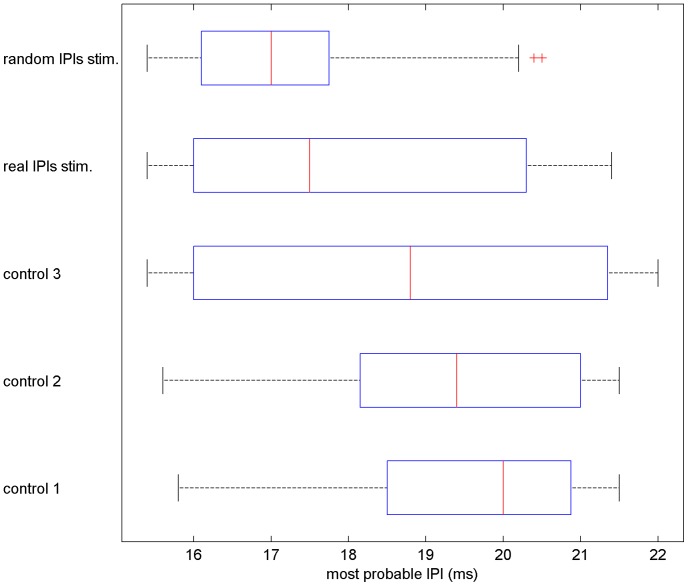
Figure 7. Most probable IPIs for control and stimuli sessions.
The most probable IPIs discharged during the stimuli sessions were smaller than those for the control sessions, the medians were 17.0(Wilcoxon p<0.05). However, there were no differences among the most probable IPIs discharged during the control sessions (no stimuli sessions; Friedman p>0.05).

