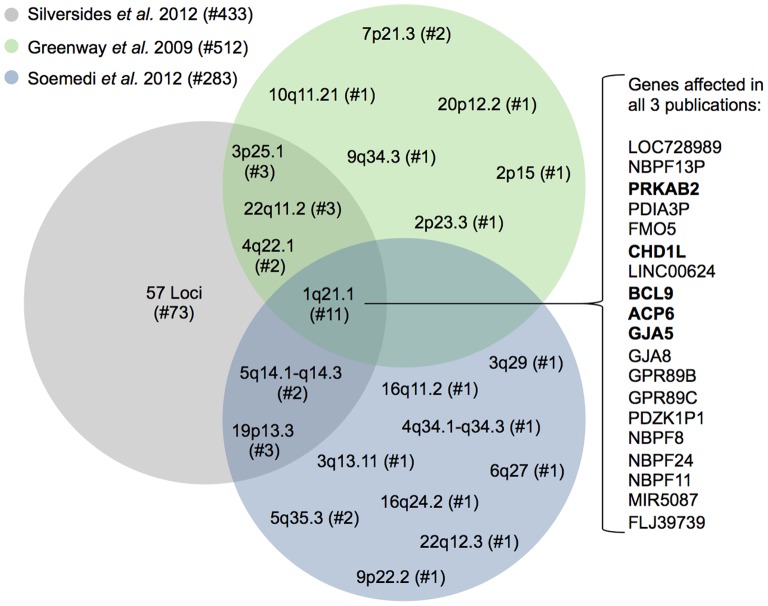
Figure 1. Overlap of three recent CNV studies in TOF patients.
All three studies are based on SNP arrays. Loci with detected CNVs are depicted according to their respective cytoband. For 1q21.1, which was identified in all three studies, the RefSeq genes that are affected in at least one patient in each of the publications are listed in the order of their genomic position. Genes that are expressed in mouse heart development (E8.5– E12.0, Mouse Atlas of Gene Expression at http://www.mouseatlas.org/mouseatlas_index_html) are marked in bold. # denotes the number of individuals.

