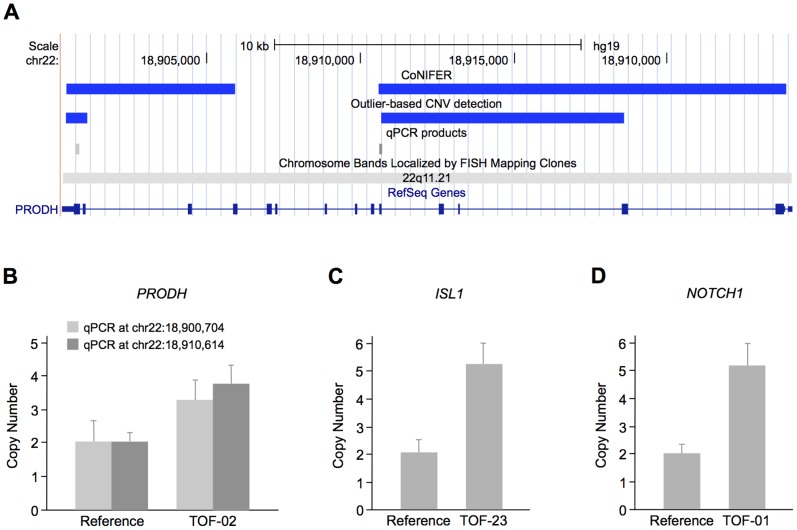
Figure 4. CNVs in TOF patients.
(A) CNVs detected in PRODH by CoNIFER and our outlier-based CNV calling method. The duplications are depicted in the UCSC Genome Browser as blue bars. The positions of the two quantitative real-time PCR products selected for validation are shown as light and dark grey bars, respectively. (B) Quantitative real-time PCR validation of PRODH copy number gains. Measurement was performed at two different positions (light and dark grey bars, respectively) and normalized to the RPPH1 gene. The HapMap individual NA10851 was used as a reference. The plot shows a representative of two independent measurements, which were each performed in triplicates. (C–D) Validation of copy number gains in ISL1 and NOTCH1, respectively, that were only identified by our outlier-based CNV calling method.

