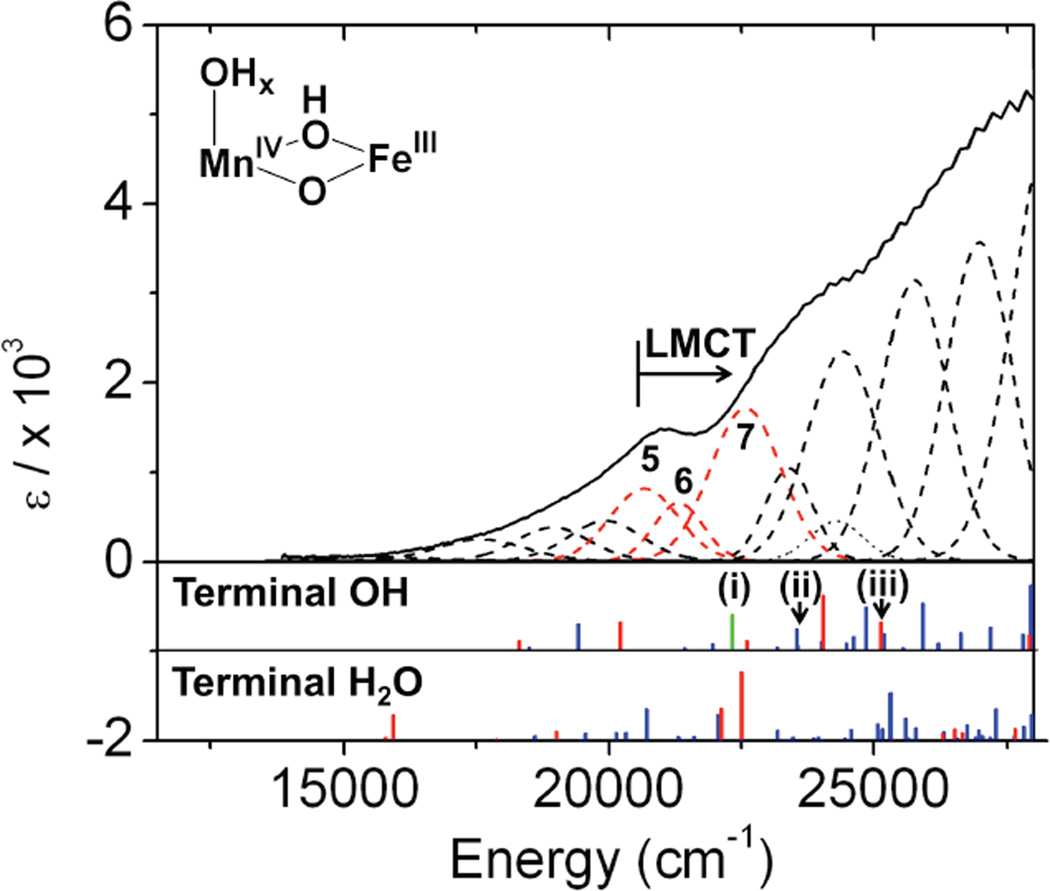
Figure 6.
LMCT Abs spectra of MnIVFeIII RNR-β (the three lowest CT bands are labeled bands 5–7) correlated to TD-DFT calculated µ-oxo → MnIV (blue), terminal OH− → MnIV (green) and µ-oxo → FeIII (red) CT transitions for two possible structures, with either OH− or H2O as the terminal ligand on Mn at site 1. The orbitals for (i), (ii), (iii) transitions are shown in Figure 7 (vide infra).

