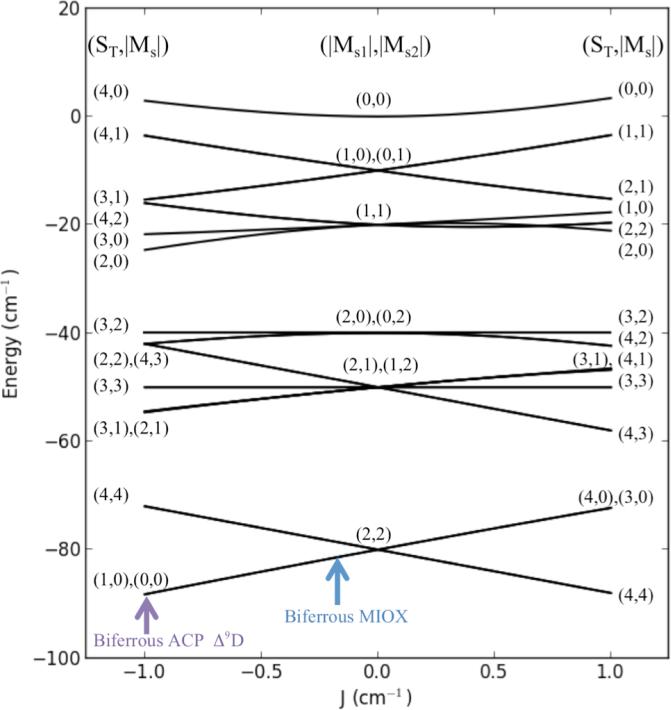
Figure 6.
The correlation diagram for a coupled Fe(II) system with both ions having negative ZFS. Correlation diagram includes only the zero field energy levels for a coupled S1 = S2 = 2 system (Equation 3 where Hx,y,z = 0) with D1 = D2 = −10 cm−1 and (E/D)1 = (E/D)2 = 0. The exchange coupling (J) is varied from +1 to −1 cm−1. The middle represents the energy splitting for only ZFS contributions (thus, an uncoupled system). The left and right sides represent antiferromagnetic (J < 0) and ferromagnetic (J > 0) interactions. The relative positions of biferrous MIOX and ACP Δ9D are indicated by the blue and purple arrows.

