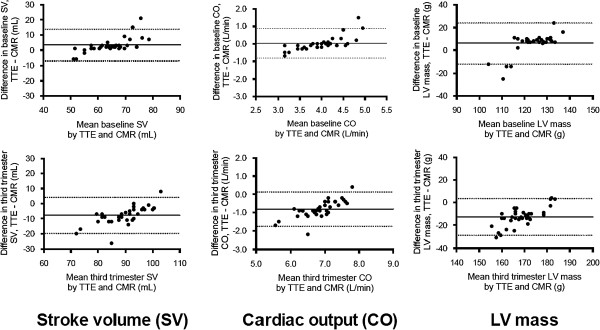
Figure 2.

Bland-Altman plots comparing TTE and CMR assessments of stroke volume (SV), cardiac output (CO) and left ventricular (LV) mass in baseline and third trimester states. Plots demonstrate TTE tending to underestimate the parameters as compared to CMR. Solid lines indicate mean difference (bias); dotted lines indicate 95% confidence intervals.
