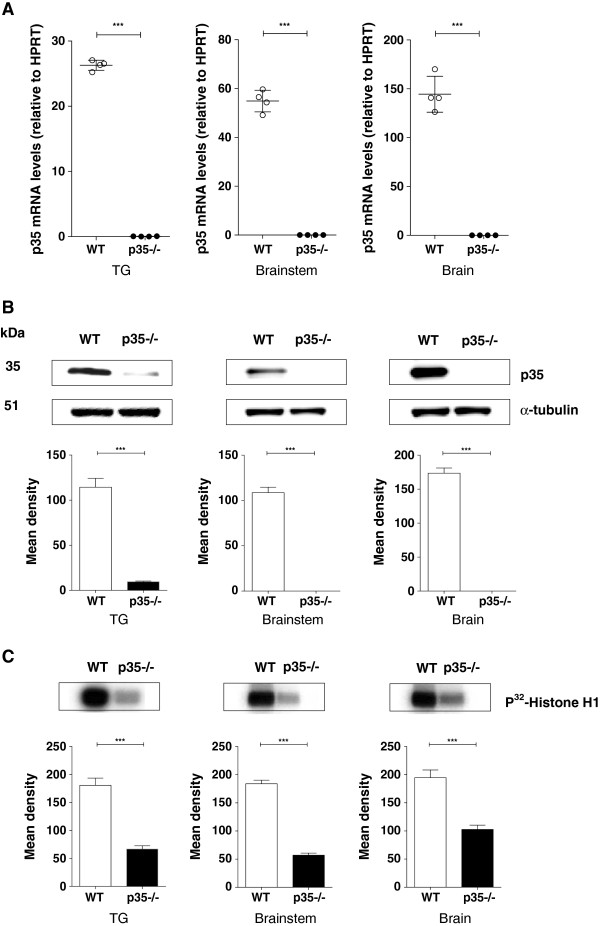
Figure 2.
Analysis of the p35 expression profile in p35 knockout mice. The p35 expression levels and Cdk5 activity in the trigeminal ganglia, brainstem, and brain of the p35 knockout mice: (A) q-PCR analysis revealed significantly decreased levels of p35 mRNA in the trigeminal ganglia, brainstem, and brain of the p35 knockout mice. Each data set was normalized to the expression seen in control wild-type animals. Results obtained from four different animals are expressed as mean ± SEM and analyzed by an unpaired t-test (***p < 0.001). (B) Representative Western blots showing p35 protein levels from p35 knockout mice together with corresponding, densitometric analysis. Data were normalized to the levels of p35 in wild-type controls, and are presented as mean ± SEM (unpaired t-test, ***< 0.001). (C) Cdk5 activity in the trigeminal ganglia, brainstem, and brain of the p35 knockout mice. Data are presented as mean ± SEM and analyzed by an unpaired t-test (**p < 0.01, ***p < 0.001).

