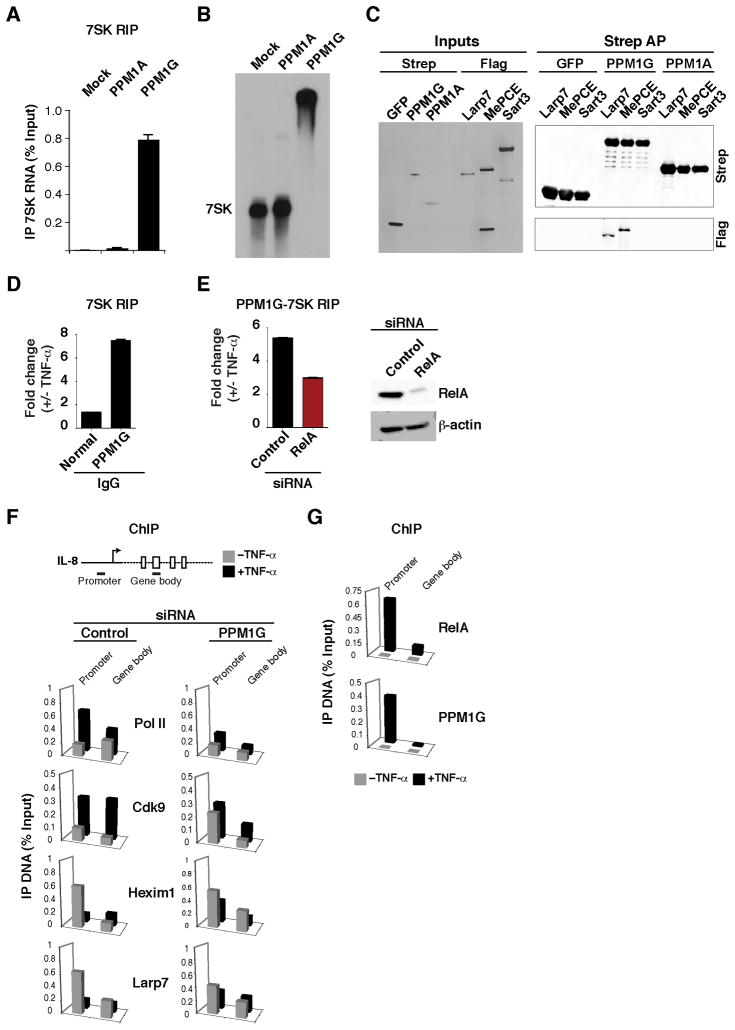
Figure 6. PPM1G binds the 7SK snRNP and participates in the NF-κB–mediated disassembly of the promoter-assembled snRNP at inflammatory-responsive genes.
(A) HeLa cells were transfected with an empty vector (Mock) or Strep-tagged PPM1A or PPM1G plasmids and levels of 7SK RNA co-immunoprecipitating were quantified by RT-qPCR (Mean ± SEM are shown, n=3).
(B) PPM1G binds 7SK RNA. Gel shift assay between in vitro synthesized 7SK RNA and His-tagged, bacterial PPM1A or PPM1G. Mock denotes incubation of 7SK RNA in binding buffer with a purification from bacterial cells transformed with an empty vector.
(C) PPM1G binds 7SK snRNP core components. Left panel shows a silver stained gel of input proteins purified from 293T in the presence of RNase A. The Flag-tagged proteins were incubated with GFP, PPM1G or PPM1A bound to Strep beads. Right panel shows Western blots of the Strep AP.
(D) Stimulus-dependent recruitment of PPM1G to the 7SK RNA. HeLa cells were treated with or without TNF-α and endogenous PPM1G was immunoprecipitated using a specific serum and levels of PPM1G-bound 7SK RNA were quantified by RT-qPCR. Normal IgG was used as negative control (Mean ± SEM are shown, n=4).
(E) PPM1G-7SK RIP. Left panel, HeLa cells were transfected with control or RelA siRNAs and treated with or without TNF-α and a RIP assay was performed to quantify the amount of endogenous PPM1G-bound 7SK RNA by RT-qPCR (Mean ± SEM are shown, n=3). Right panel Western blots to validate the knockdown.
(F) ChIP assay to analyze the distribution of Pol II and P-TEFb-7SK snRNP subunits at the IL-8 locus. HeLa cells were transfected with a control or PPM1G siRNA and treated with (black bars) or without (grey bars) TNF-α. Values represent the average of three independent experiments. The SEM is less than 5% and not shown for simplicity.
(G) ChIP assay to analyze the distribution of RelA and PPM1G at the IL-8 locus in HeLa cells treated with (black bars) or without (grey bars) TNF-α. Values represent the average of four independent experiments. The SEM is less than 5% and not shown for simplicity. See also Figure S6.

