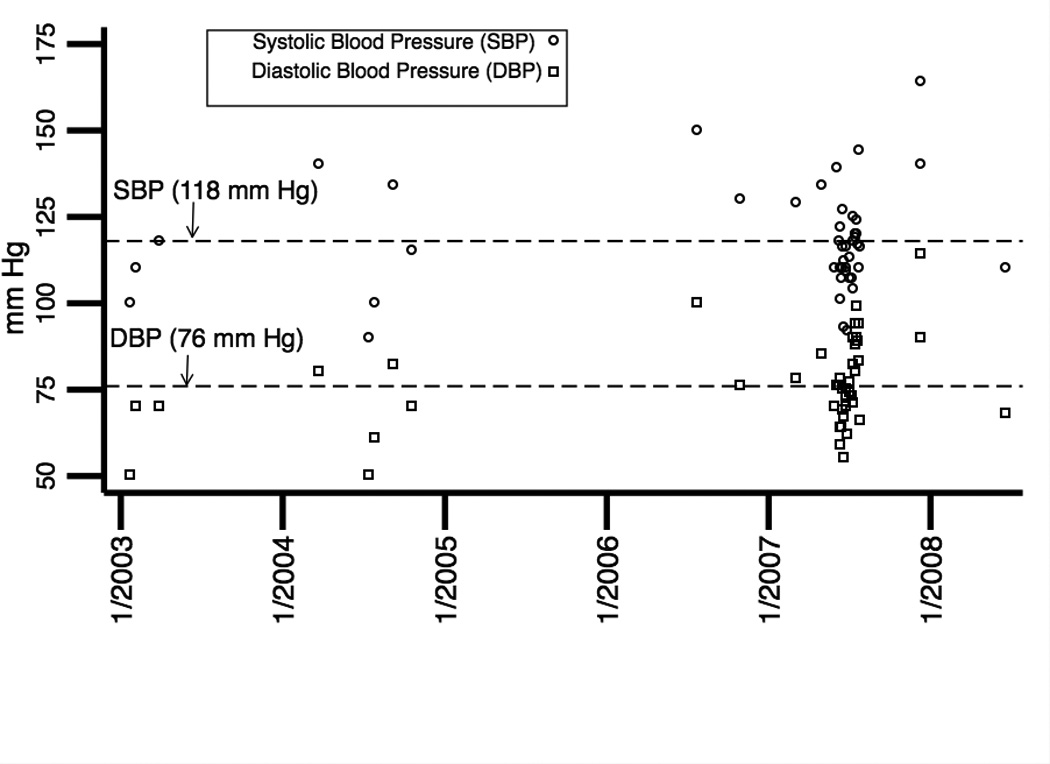
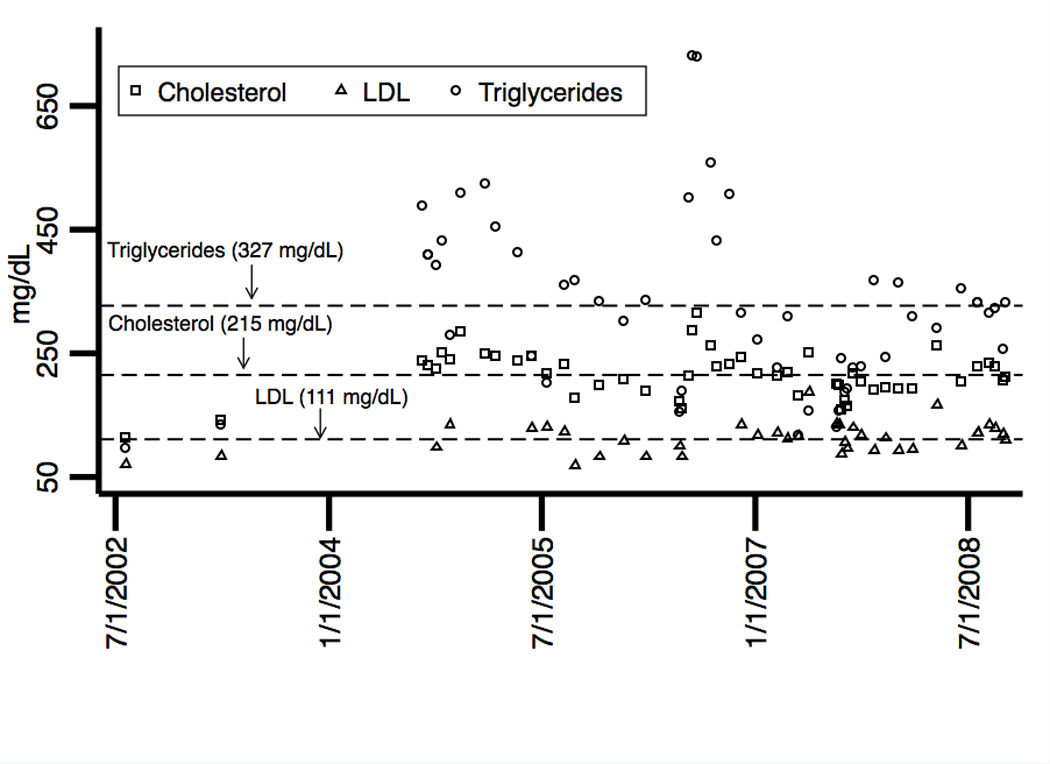
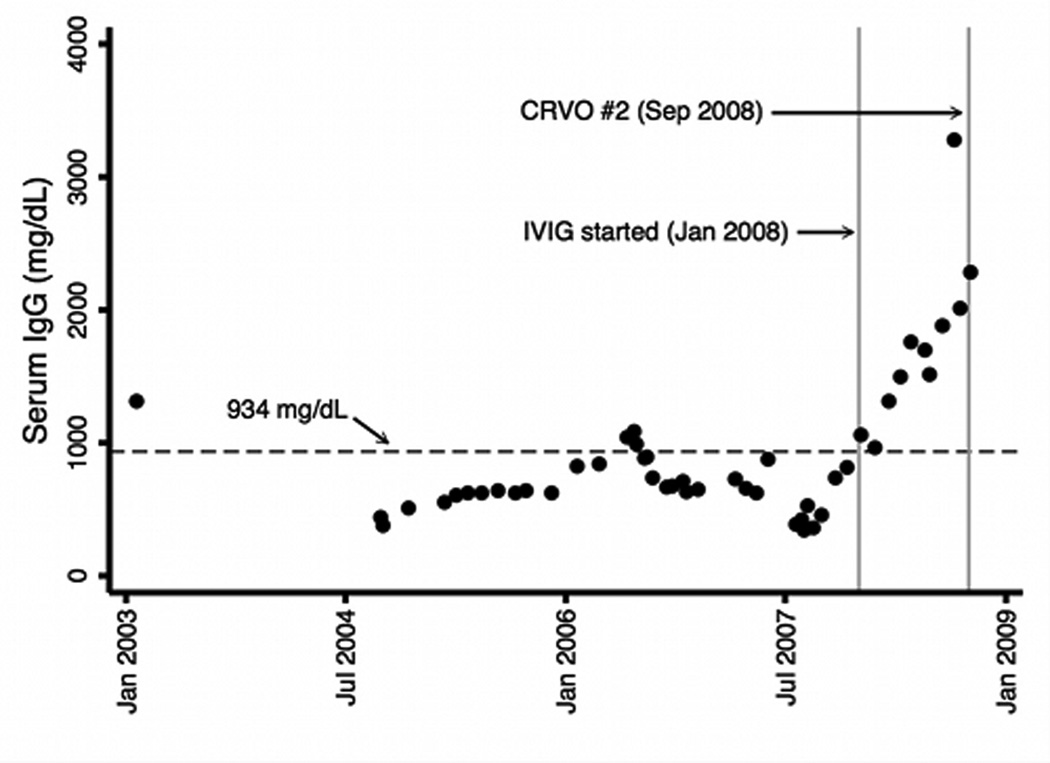
Figure 7.


Plotted as a function of time are the patient’s: (a) systolic and diastolic blood pressures, (b) cholesterol, LDL, and triglyceride levels and (c) serum IgG levels. Mean levels over the time periods are indicated by horizontal dashed reference lines. Of significance, triglyceride levels were elevated. Intravenous immunoglobulin (IVIG) was initiated in January 2008 and serum IgG levels sharply increased preceding the second CRVO in September 2008.

