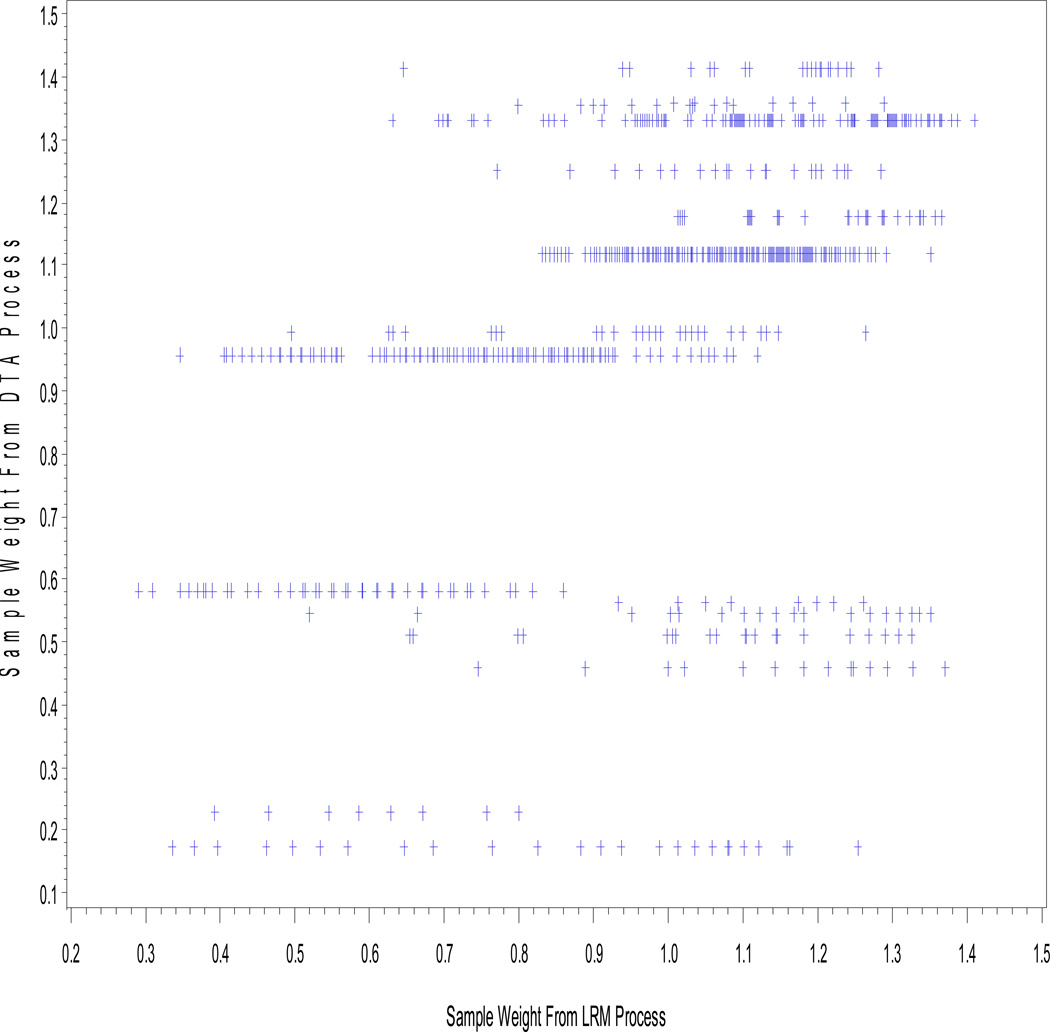
Figure 2. Scatterplot of DTA determined weights as a function of LRM determined weights.
(Note: Probabilities were transformed to relative weights, with possible weight scores being greater than 0. The correlation between the two weights was found to be r = 0.482. The bars reflect the relatively lower resolution of the optimal classification tree where 23 terminal nodes are used to identify the probabilities of study association.)

