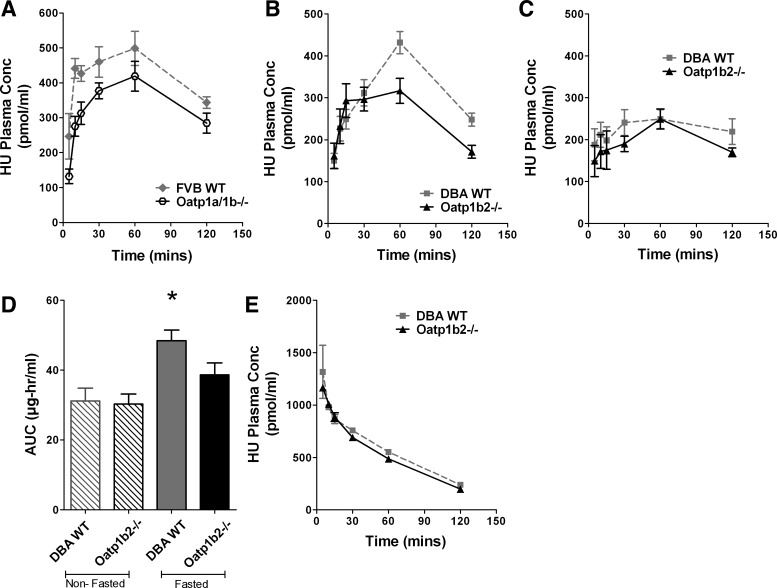
Fig. 2.
Plasma pharmacokinetics (PK) of hydroxyurea in vivo. A: plasma concentration (Conc) of hydroxyurea in Oatp1a/1b−/− mice (black open circle) compared with FVB wild-type (gray diamond) mice following oral administration (n = 4). B and C: plasma concentration of hydroxyurea in Oatp1b−/− mice (black triangle) compared with wild-type mice on a DBA1/lacJ background (DBA WT; gray square) following oral administration after a 3-h food fast (n = 9–12) (B) and after nonfasting conditions (C). D: systemic exposure in DBA wild-type and Oatp1b−/− mice with and without fasting (*P = 0.0009 compared with all other conditions). AUC, area under the curve. E: plasma concentration of hydroxyurea in DBA wild-type and Oatp1b−/− mice following intravenous administration.

