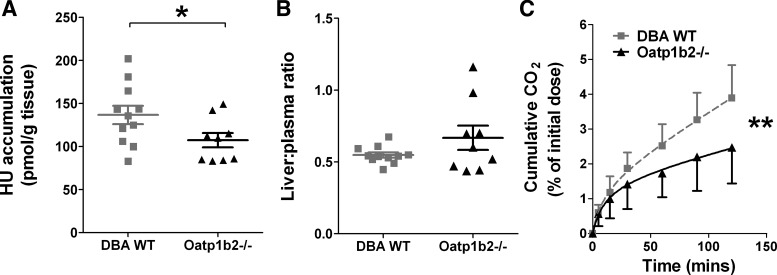
Fig. 5.
Hepatic accumulation and exhaled CO2 metabolite of hydroxyurea. A: hydroxyurea accumulation in liver of DBA wild-type and Oatp1b−/− mice (*P = 0.05). B: liver-to-plasma ratio of hydroxyurea in DBA wild-type and Oatp1b−/− mice. C: cumulative amount of 14CO2 exhaled by DBA wild-type (gray squares) and Oatp1b−/− (black triangles) mice measured by breath test (n = 5–10; **P = 0.035).

