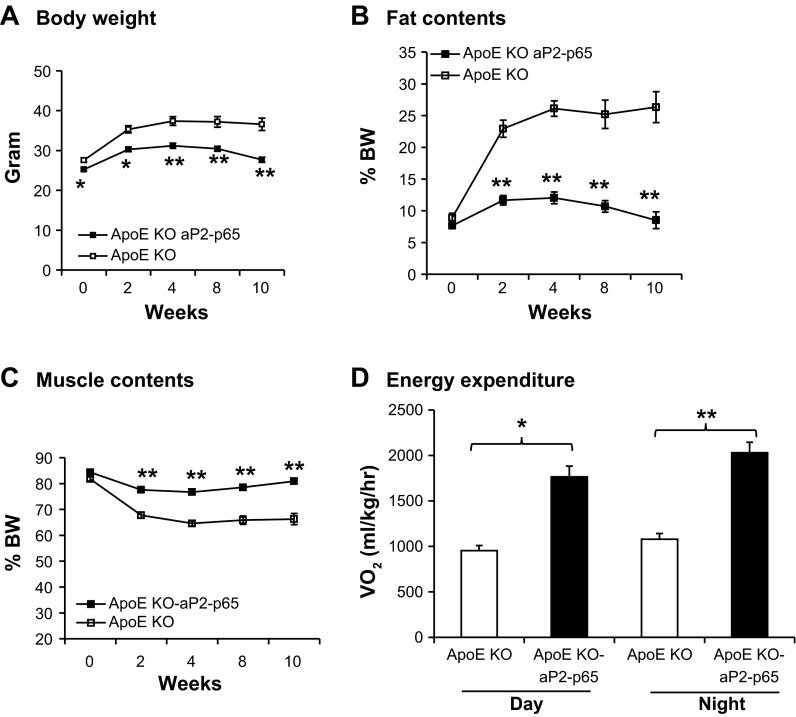
Fig. 5.
Enhanced energy expenditure in Tg mice. A: body weight was measured every 2 wk. B: fat percentage was presented by total fat mass normalized with body weight. C: muscle percentage was presented by total fat mass normalized with body weight. D: energy expenditure was measured in a metabolic chamber. V̇o2 was normalized with lean body mass; n = 12. Data presented by means ± SE. *P < 0.05, **P < 0.001 by Student's paired t-test.

