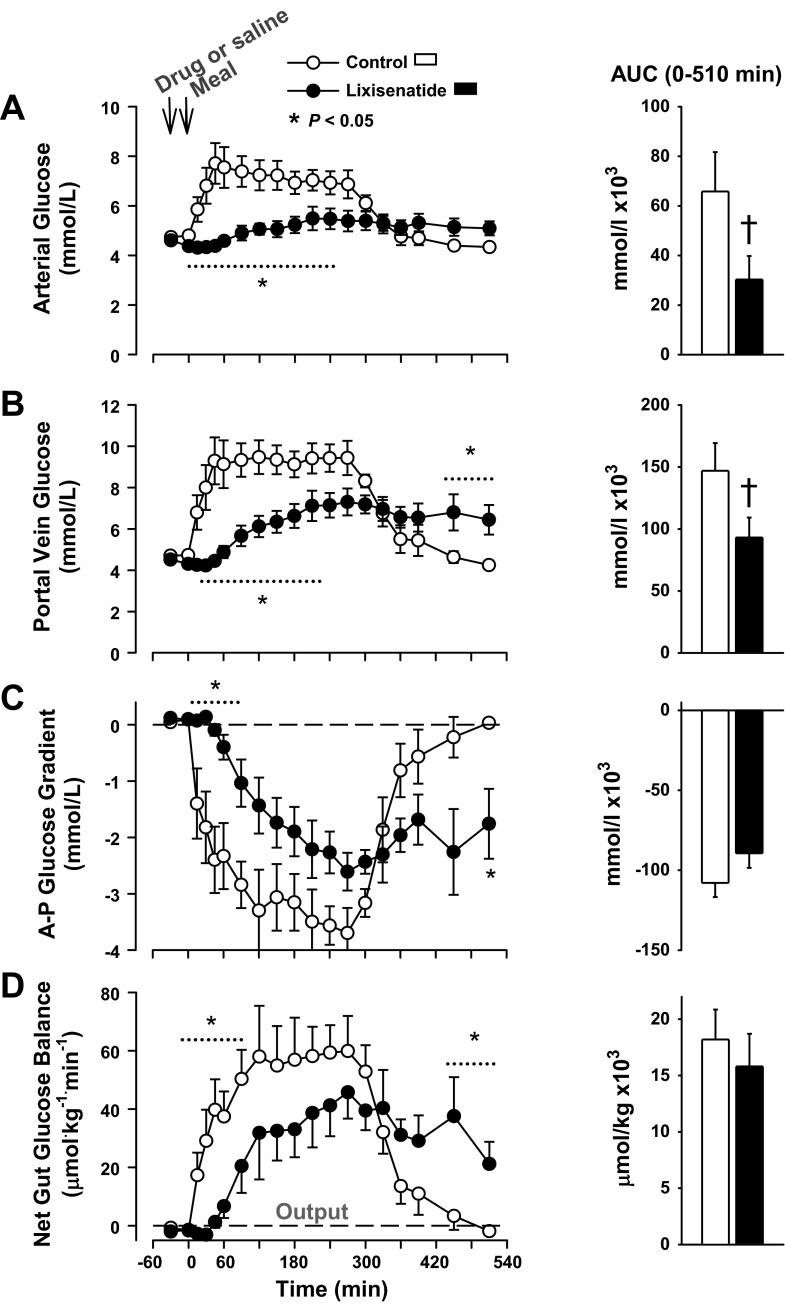
Fig. 3.
Arterial (A) and portal vein (B) blood glucose, the arterial-portal (A-P) glucose gradient (C), and net gut glucose balance (D) in the control and lixisenatide groups; n = 6/group. Data are means ± SE. There was a significant (P < 0.05) group × time interaction for all time course data; *data points that differed on post hoc analysis. The histograms show the areas under the curve (AUCs) for the postprandial period; †P < 0.05 between groups using an unpaired t-test.

