Fig. 6.
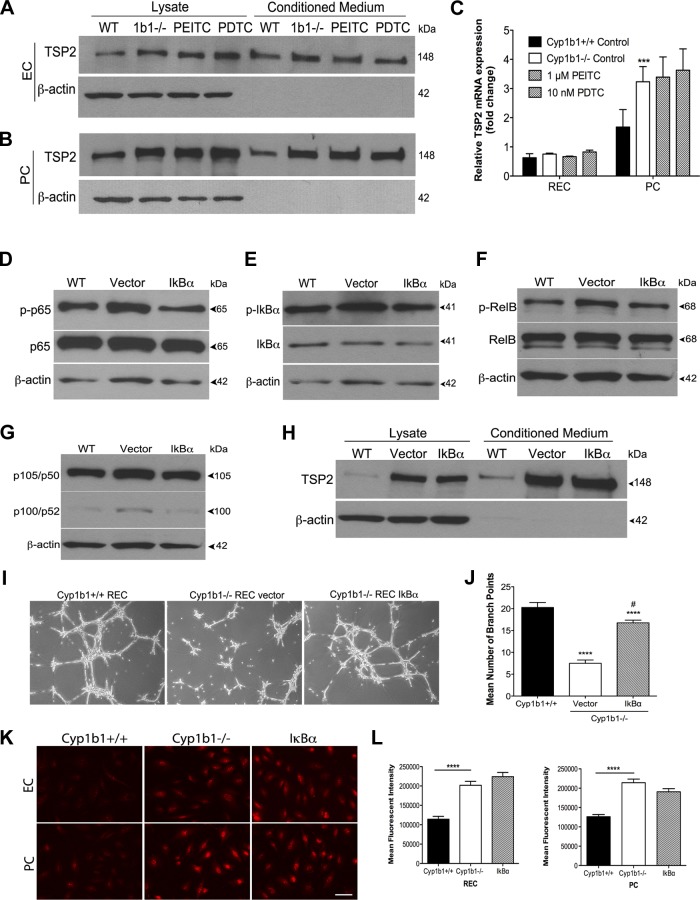
Suppression of NF-κB activity does not alter TSP2 levels. A and B: cyp1b1−/− EC and PC were incubated with PEITC or PDTC in serum-free medium for 48 h, and lysates and conditioned medium were collected and evaluated for TSP2 and β-actin expression by Western blot analysis. C: relative TSP2 mRNA level was analyzed using real-time qPCR in cyp1b1+/+ and cyp1b1−/− EC and PC after incubation with PEITC and PDTC (n = 9). ***P < 0.001. D–G: cyp1b1−/− PC were transfected with empty vector or dominant-negative (DN)-mIκBα plasmid for 48 h, and lysates were evaluated for phosphorylated p65, total p65, phosphorylated IκBα (p-IκBα), total IκBα, phosphorylated RelB (p-RelB), total RelB, p105/p50, p100/p52, and β-actin. WT, cyp1b1+/+; Vector, cyp1b1−/− empty vector; IκBα, cyp1b1−/− DN-mIκBα plasmid. H: cyp1b1−/− PC were transfected with empty vector or DN-mIκBα plasmid for 48 h and incubated in serum-free medium for 48 h. Lysates and conditioned medium were collected and evaluated for TSP2 and β-actin expression by Western blot analysis. Note lack of effect on TSP2 level in cyp1b1−/− PC expressing DN-mIκBα compared with vector control. I: cyp1b1−/− EC were transfected with empty vector or DN-mIκBα plasmid for 48 h. Capillary morphogenesis was determined by plating transfected cells on Matrigel and capturing images in digital format after 18 h. Representative images are shown. J: mean number of branch points (n = 3). ****P < 0.0001; #P < 0.05 vs. cyp1b1−/− (control). K: oxidative stress was measured by dihydroethidium (DHE) staining in cyp1b1+/+ and cyp1b1−/− EC and PC 48 h posttransfection using empty vector (cyp1b1−/−) or DN-mIκBα plasmid (IκBα). Representative images are shown. Scale bar, 50 μm. L: quantitative assessment of mean fluorescence intensity (n = 3). Note lack of effect on oxidative stress levels in cells expressing DN-mIκBα compared with control cells. ****P < 0.0001.

