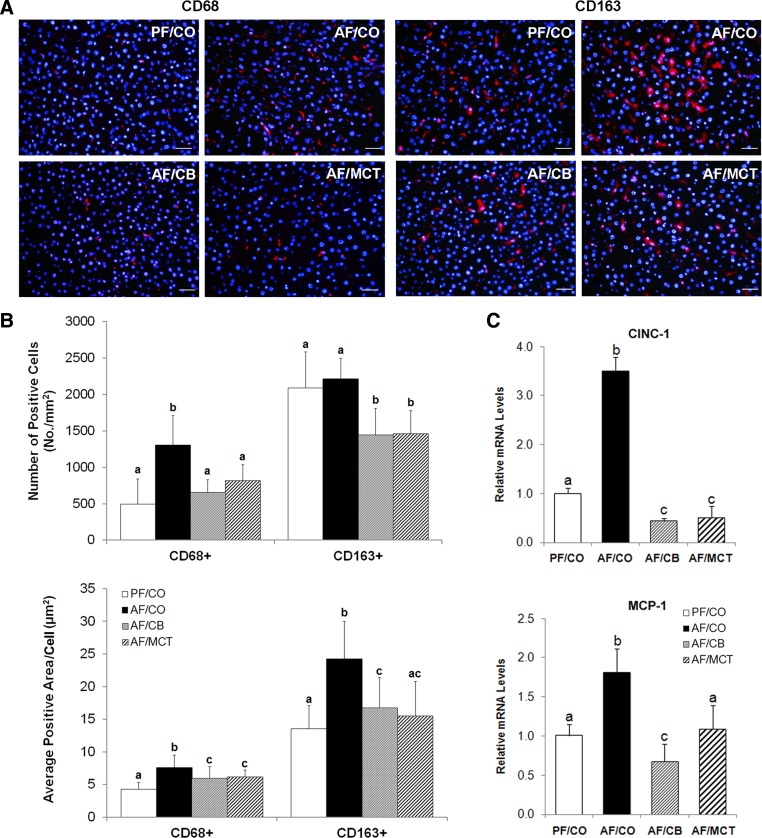
Fig. 4.
Hepatic inflammation in rats after ethanol feeding with different dietary fats for 8 wk. A: macrophages in the liver detected by immunofluorescence staining. Scale bar: 20 μm. Red: CD68+ or CD163+ macrophages; blue: 4′,6-diamidino-2-phenylindole (DAPI) counterstaining of nuclei. B: quantitative analysis of CD68+ and CD163+ macrophages in the liver by Image Pro Premier (n = 25–35). C: hepatic cytokine/chemokine expressions of cxcl1/CINC-1 and ccl2/MCP-1 measured by quantitative PCR (qPCR). The relative gene expression was normalized to 18s rRNA expression and calculated by the 2−ΔΔCt method setting the value of PF/CO as 1. Results are means ± SD (n = 6). Significant differences (P < 0.05, ANOVA) are indicated by different letters.

