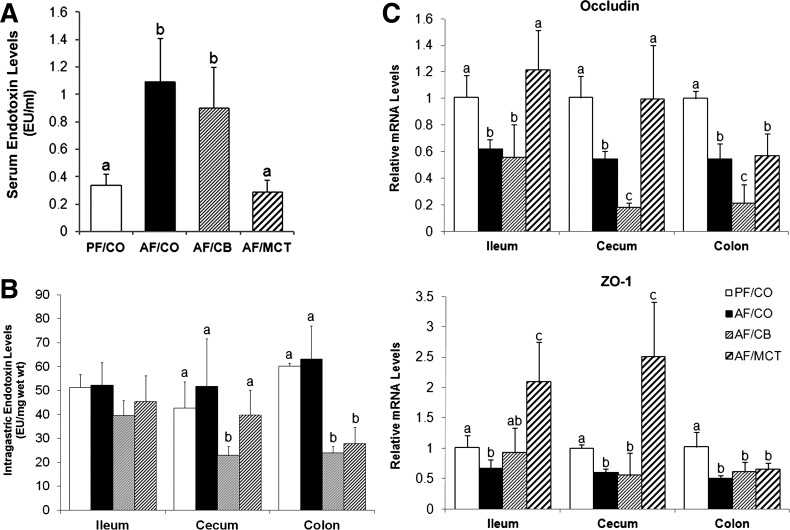
Fig. 6.
Endotoxemia and intestinal tight junction expression in rats fed ethanol with different dietary fats for 8 wk. A: serum endotoxin levels. Endotoxin levels were measured by the limulus amoebocyte lysate method, and results were expressed in endotoxin units (EU) per milliliter serum. B: intestinal luminal endotoxin levels. Endotoxin levels within the intestinal lumen were expressed in EU per milligram wet weight. C: gene expressions of occludin and zonula occludens (ZO-1) measured by qPCR. The relative gene expression was normalized to 18s rRNA expression and calculated using the 2−ΔΔCt method, setting the value of PF/CO as 1. Results are means ± SD (n = 6–8). Significant differences (P < 0.05, ANOVA) are indicated by different letters.

