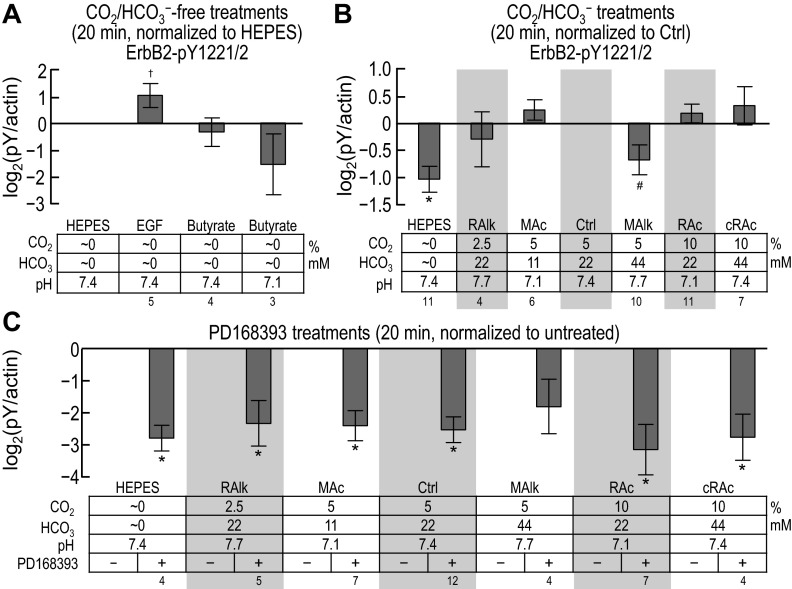
Fig. 11.
Quantification of ErbB2 immunoreactivity at pY1221/pY1222 after solution treatments of 20 min. Except for the duration of the treatments, this figure is identical to Fig. 10. Sample sizes (n) are shown beneath each graph. †Bar for which all constituent data points are <0 (or >0) but not statistically different from 0. #Bar for which P < 0.05 (compared with 0 by a one-tailed, paired t-test); in the text, we state that the parameter “tends or tended” to rise/fall. *Bar that is significantly different from 0, even after the very conservative Bonferroni correction (P < 0.05 divided by the number of treatment solutions considered); in the text, we refer to the change as “significant.”

