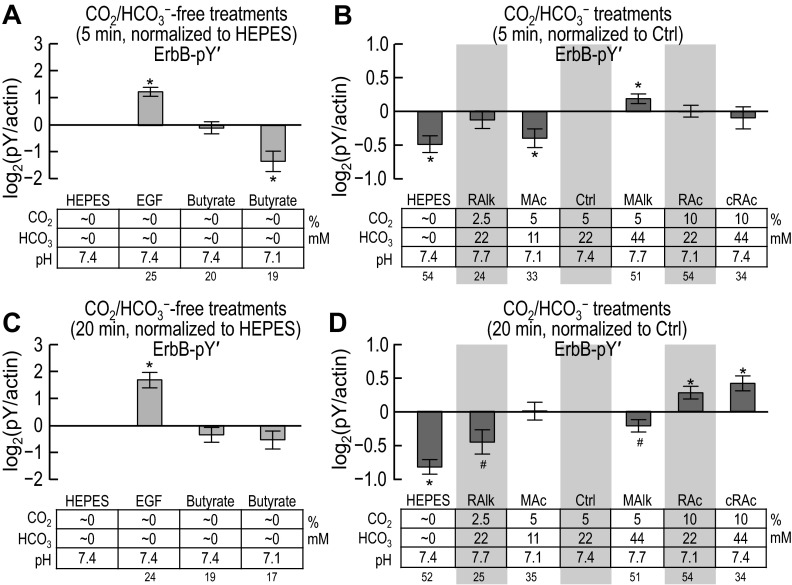
Fig. 12.
Quantification of pseudo-pan-ErbB1/2-pY (ErbB-pY′) after solution treatments of 5 and 20 min. The responses of ErbB1-pY845, ErbB1-pY992, ErbB1-pY1068, ErbB1-pY1173 (Figs. 7 and 8), and ErbB2-pY1221/pY1222 (Figs. 10 and 11) were summed to provide an approximation of the pan-ErbB1/2-pY response to the various acid-base disturbances. A: ErbB-pY′ at 5 min for nominally CO2/HCO3−-free treatments, normalized to ErbB-pY′ for the nominally CO2/HCO3−-free HEPES treatment at 5 min. B: ErbB-pY′ at 5 min for nominally CO2/HCO3−-free HEPES and CO2/HCO3− solutions, normalized to ErbB-pY′ for our Ctrl treatment (5% CO2/22 mM HCO3−). C: ErbB-pY′ at 20 min for nominally CO2/HCO3−-free treatments, normalized to ErbB-pY′ for the HEPES treatment at 20 min. D: ErbB-pY′ at 20 min for HEPES and CO2/HCO3− solutions, normalized to ErbB-pY′ for our control treatment (5% CO2/22 mM HCO3−). Sample sizes (n) are shown beneath each graph. #Bar for which P < 0.05 (compared with 0 by a one-tailed, paired t-test); in the text, we state that the parameter “tends or tended” to rise/fall. *Bar that is significantly different from 0, even after the very conservative Bonferroni correction (P < 0.05 divided by the number of treatment solutions considered); in the text, we refer to the change as “significant.”

