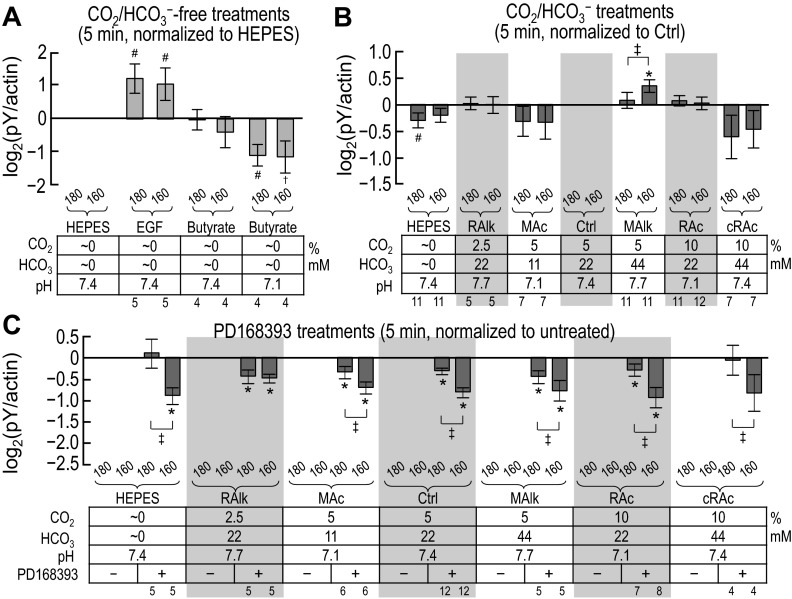
Fig. 4.
Quantification of pY immunoreactivity after solution treatments of 5 min. Shown are the results of densitometry of blots similar to those shown in Fig. 3. For each treatment, pan-pY was first normalized to actin. A: ratios of pan-pY to actin (pan-pY/actin) for nominally CO2/HCO3−-free treatments, normalized to pan-pY/actin for the nominally CO2/HCO3−-free HEPES treatment. B: pan-pY/actin for nominally CO2/HCO3−-free HEPES and CO2/HCO3− solutions, normalized to pan-pY/actin for our Ctrl treatment (5% CO2/22 mM HCO3−). C: pan-pY/actin for treatments like those in B but with and without the ErbB inhibitor PD-168393, normalized to pan-pY/actin for the equivalent treatment without PD-168393. Sample sizes (n) are shown beneath each graph. †Bar for which all constituent data points are <0 (or >0) but not statistically different from 0. #Bar for which P < 0.05 (compared with 0 by a one-tailed, paired t-test); in the text, we state that the parameter “tends or tended” to rise/fall. *Bar that is significantly different from 0, even after the very conservative Bonferroni correction (P < 0.05 divided by the number of treatment solutions considered); in the text, we refer to the change as “significant.” ‡Pair of bars for which P < 0.05 (compared with each other by a one-tailed, paired t-test).

