
Fig. 12.
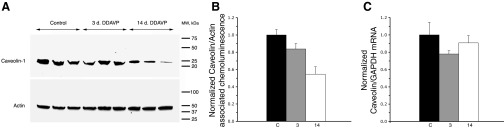
Quantitative analysis of Cav1 protein and mRNA levels in the kidney of control and DDAVP-treated BB rats. A: total kidney homogenates from control and DDAVP-treated BB rats (duration of treatment: 3 days or 2 wk) were subjected to SDS-PAGE and immunoblotted with an anti-Cav1 antibody. The loading control was performed with an anti-actin antibody. B: chemiluminescence intensities of Cav1 and actin protein bands from control (C) and DDAVP-treated rats (3 days and 2 wk) were quantified. The results from five different experiments were averaged and normalized to the mean of the respective control group and are shown as means ± SE; n = 3 rats/group. The results indicate a decreasing trend in Cav1 protein levels during DDAVP treatment, becoming statistically significant after 14 days (P = 0.007 compared with control rats and P = 0.026 compared with 3-day DDAVP-treated rats). C: total RNA was extracted from control and DDAVP-treated rats (3 days and 2 wk) (n = 3 rats/group), and quantitative real-time PCR analysis was performed for Cav1 and GAPDH (as a control). Cav1 mRNA data from three different experiments were normalized to their respective GAPDH mRNA values and subsequently to the average of the respective control group. Average results are plotted as means ± SE and showed no statistically significant changes.