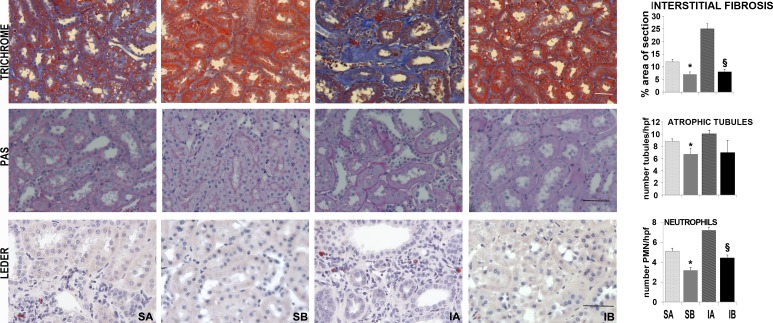
Fig. 2.
Effects of renal cell transplantation on renal histology. Decreased fibrosis (blue, top), tubular atrophy (middle), and neutrophil infiltration (red cells, bottom) were observed in obese/diabetic rats treated with SAA-expressing cells both after sham surgery or renal ischemia. Representative trichrome-stained sections of cortex (top) as well as periodic acid-Schiff (PAS)-stained (middle) and Leder-stained (bottom) sections are included. The quantification of ×200 microscope fields/group is shown in the graphs. For interstitial fibrosis, n = 85 for the SA group, 92 for the SB group, 63 for the IA group, and 92 for the IB group. For atrophic tubules, n = 85 for the SA group, 92 for the SB group, 63 for the IA group, and 92 for the IB group. For neutrophil number, n = 45 for the SA group, 45 for the SB group, 79 for the IA group, and 47 for the IB group. Scale bar = 50 μm. *P < 0.05 vs. SA; §P < 0.05 vs. IA.

