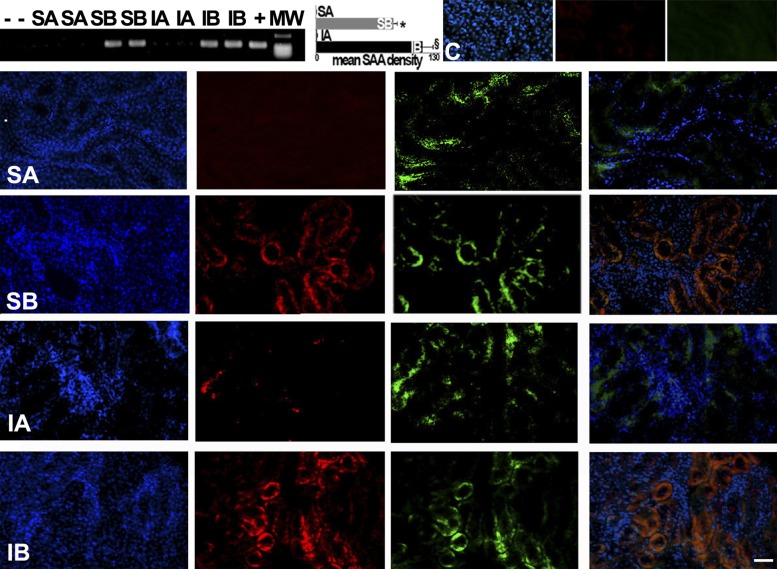
Fig. 6.
SAA expression in recipient kidneys. The presence of recipient kidney SAA mRNA was detected by RT-PCR. Quantification of band density in multiple blots is shown in the graph. SAA mRNA was found in kidneys after reprogrammed cell infusions, demonstrating transcriptional activity. The representative fluorescence images show nuclei (blue), immunoreactive SAA (red), and GFP-positive cells (green) in each group [including normal controls (C) without renal injury]. In the right images, images of nuclei, SAA, and GFP are merged to demonstrate colocalization (orange) of SAA and GFP in SB and IB groups, consistent with expression in the same cells. Scale bar = 50 μm. *P < 0.05 vs. SA; §P < 0.05 vs. IA.

